PAUT Equipment Comparison
Section titled “PAUT Equipment Comparison”Test Sample Overview
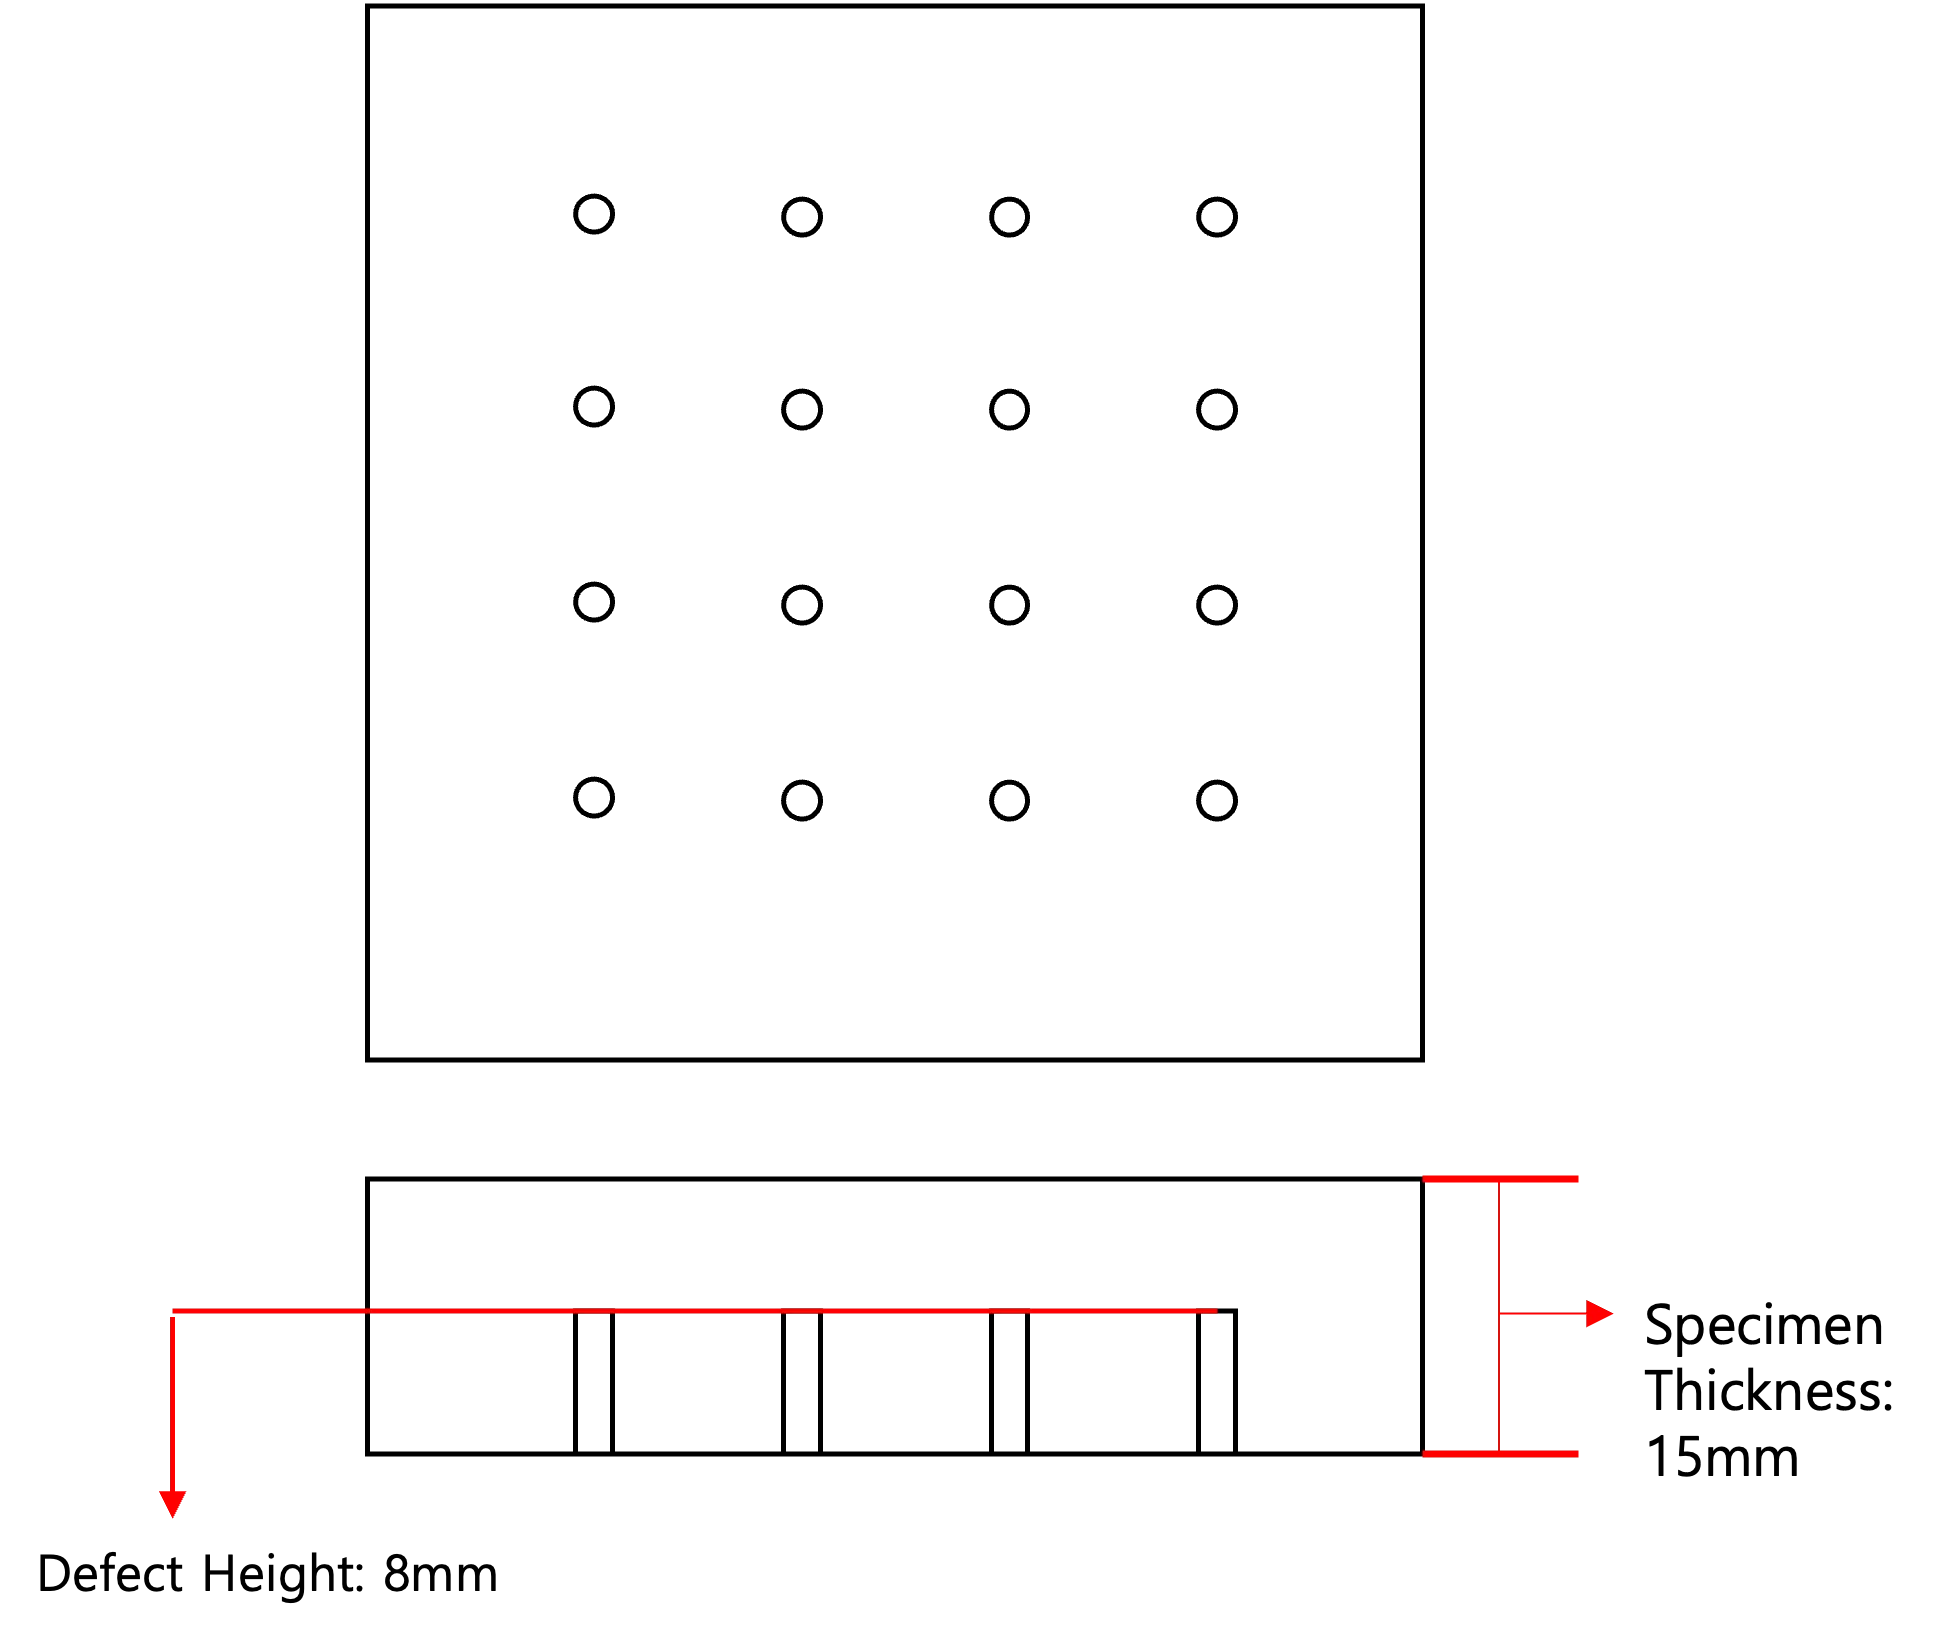
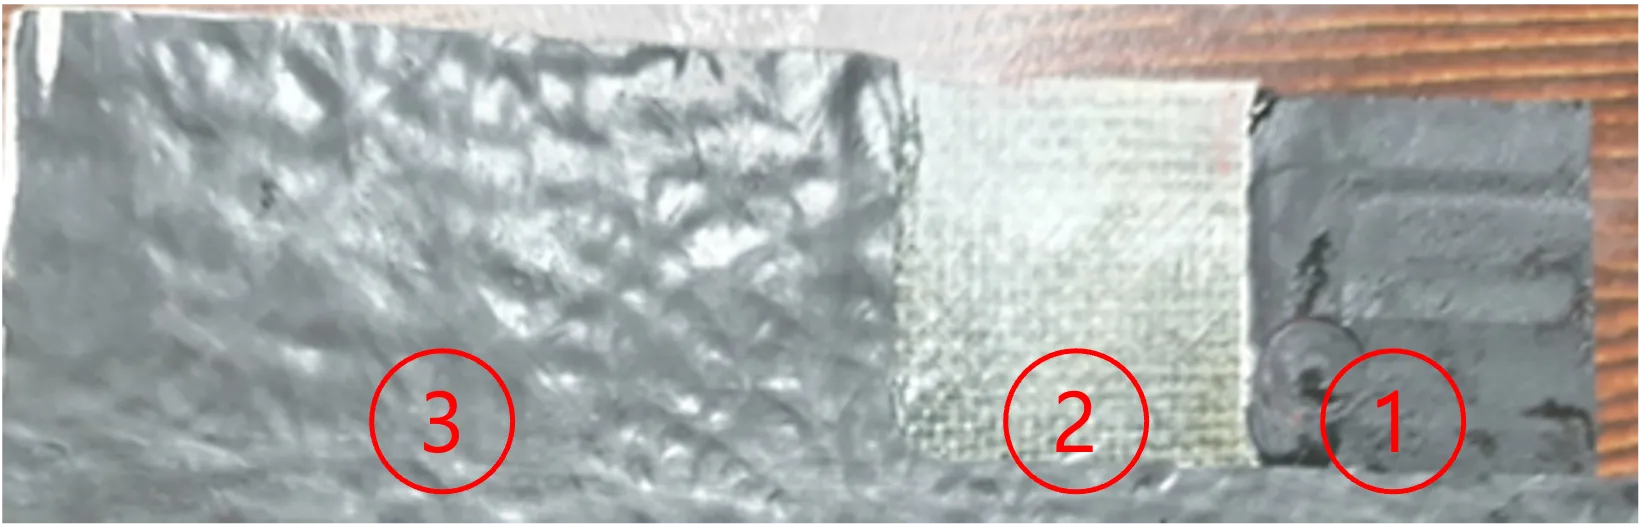
Section titled “Test Sample Overview”- Using a test block with holes drilled at varying sizes, we compared the resulting defect shapes when measured with the Phased Array Ultrasonic Testing (PAUT) systems of both the third-party equipment and the DEEPSOUND device.
Probe & Wedge Information
Section titled “Probe & Wedge Information”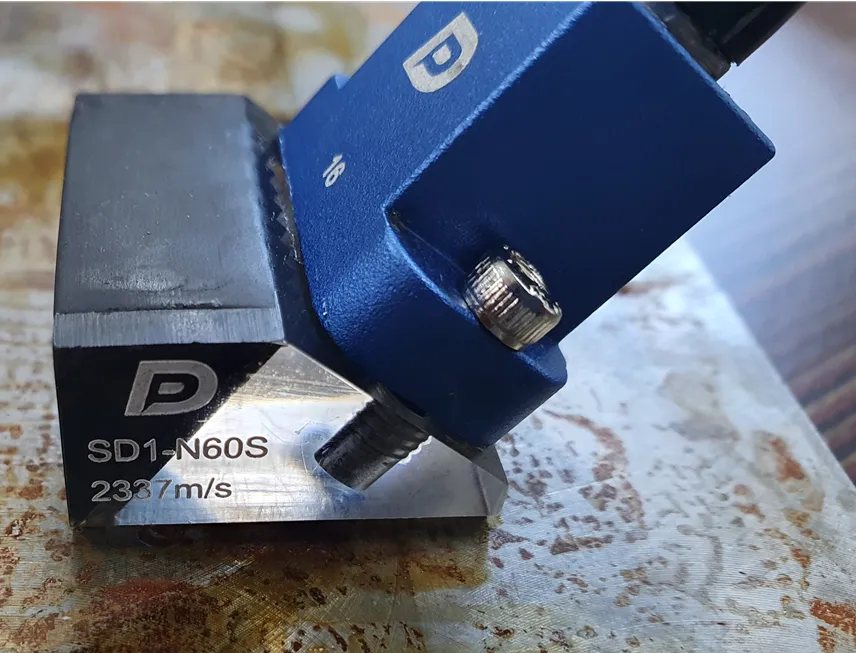
-
The specifications and configuration settings for the Probe and Wedge are established as follows:
-
Probe Specifications
- Frequency: 10 MHz
- Elements: 16 El
- Pitch: 0.6 mm
-
Wedge Specifications
- Wedge Angle: 38 degrees
- Wedge Velocity: 2337 m/s
- Height of First Element: 6.08 mm
- Primary First Element Offset:
- Third-Party > -23.14 mm / DEEPSOUND > 2.36 mm (Note: Adjusted according to each manufacturer’s respective standards)
- Wedge Height: 15.00 mm
- Wedge Length: 25.50 mm
- Wedge Width: 30.00 mm
Sectorial Scan: Settings & Image Comparison
Section titled “Sectorial Scan: Settings & Image Comparison”Sectorial Scan Settings
Section titled “Sectorial Scan Settings”- The Sectorial Scan parameter values for both the third-party equipment and the DEEPSOUND device were configured as outlined below:
Sectorial Image Comparison
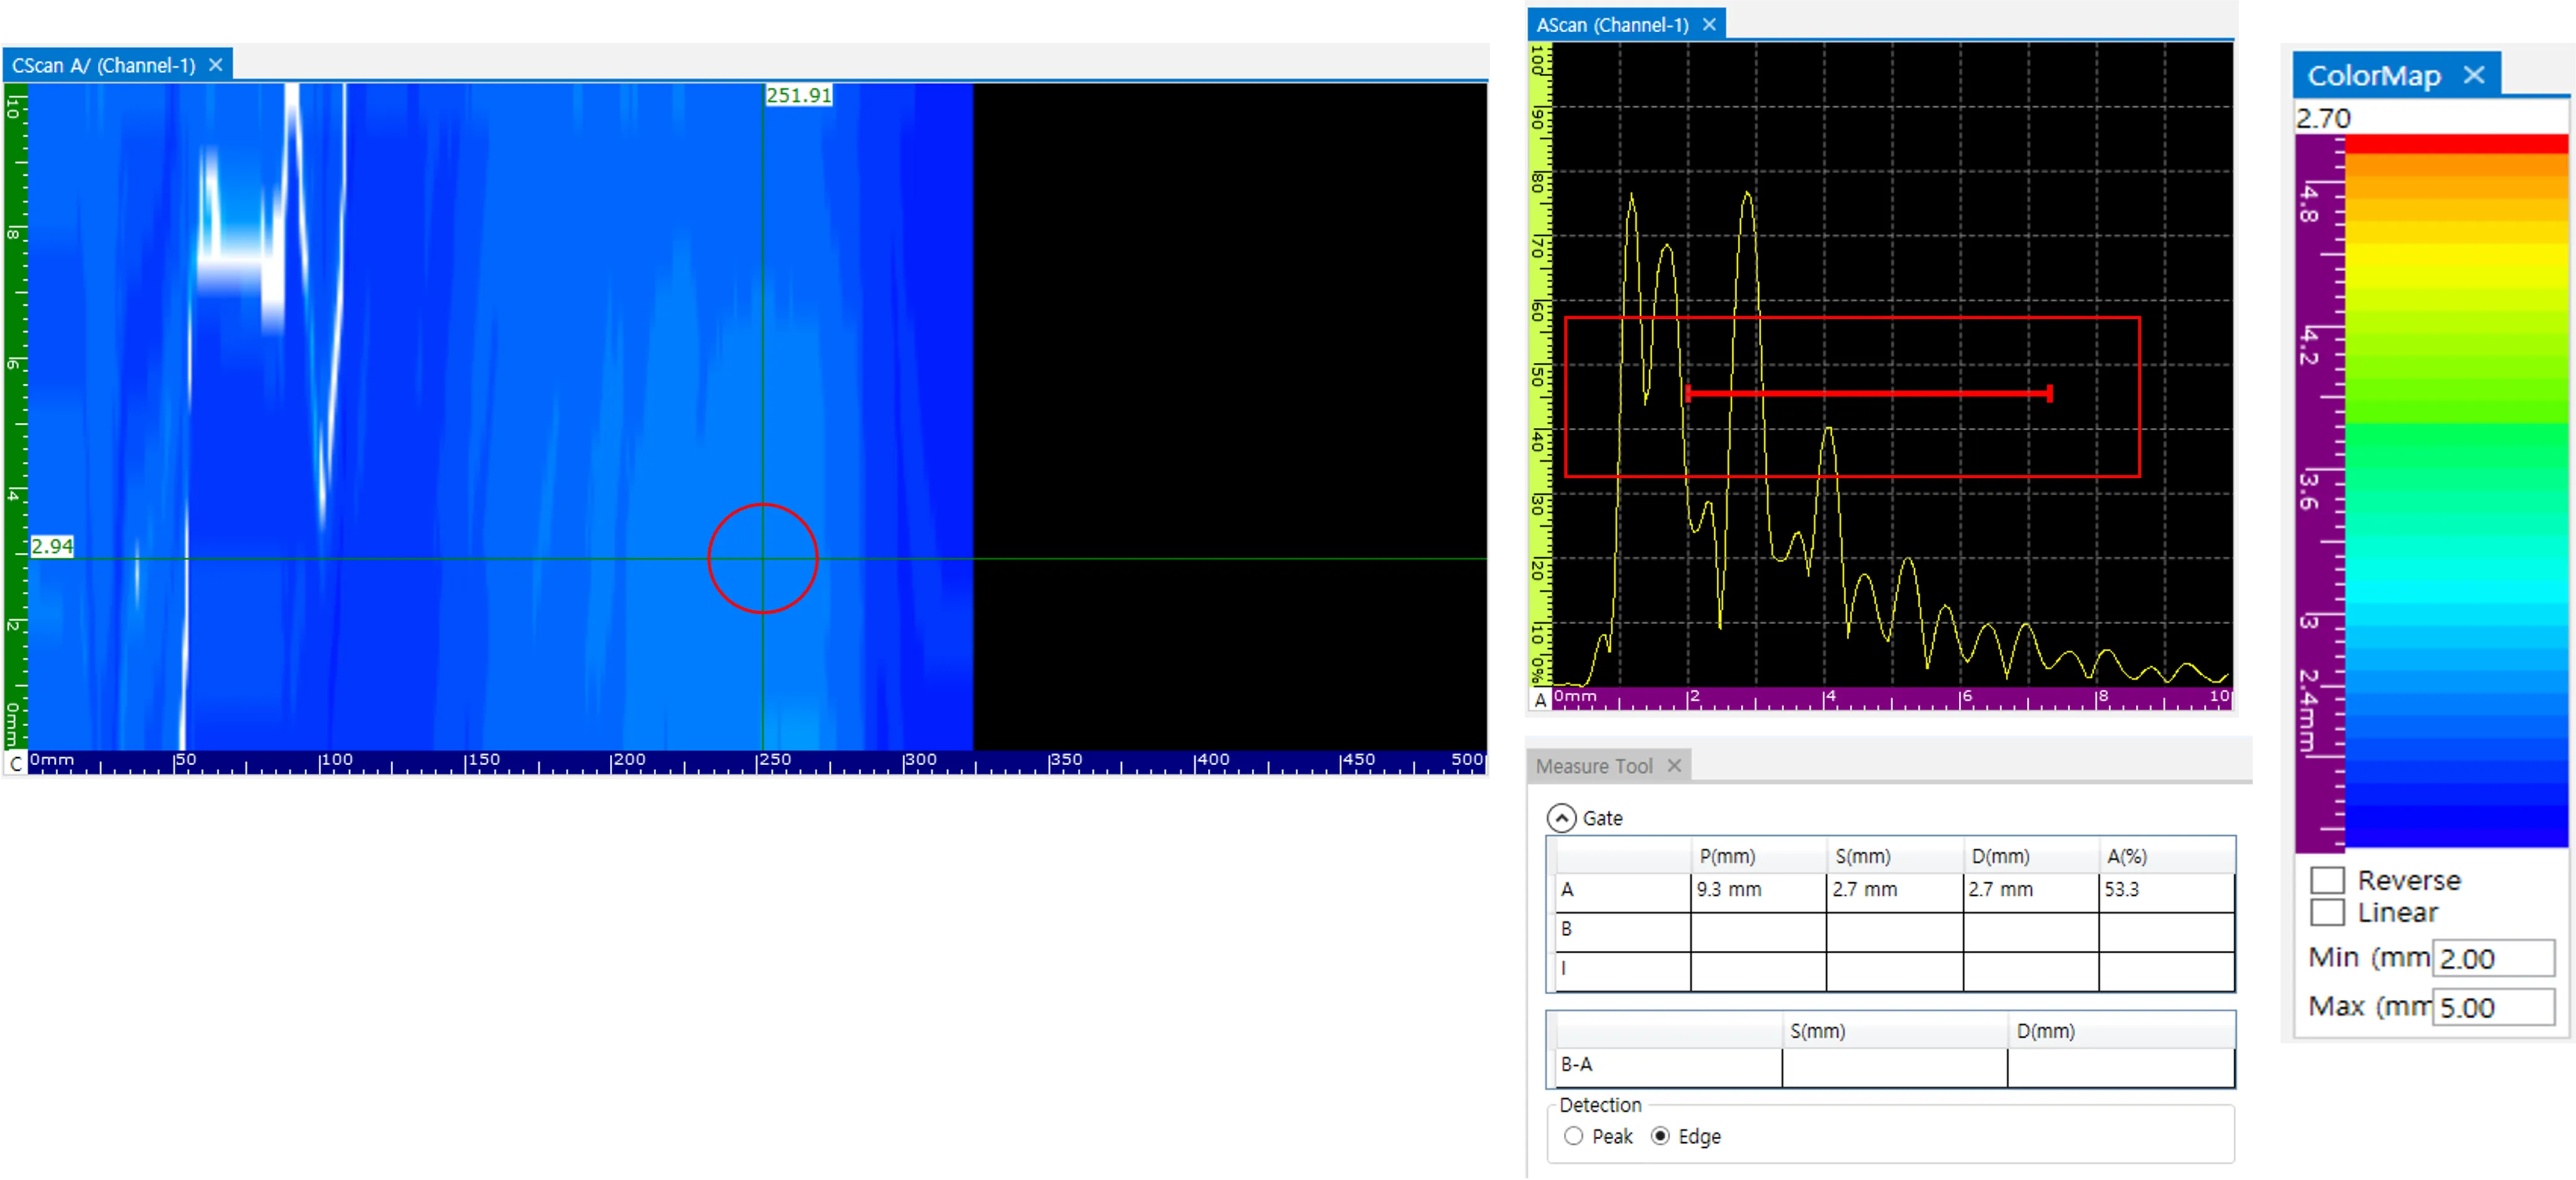
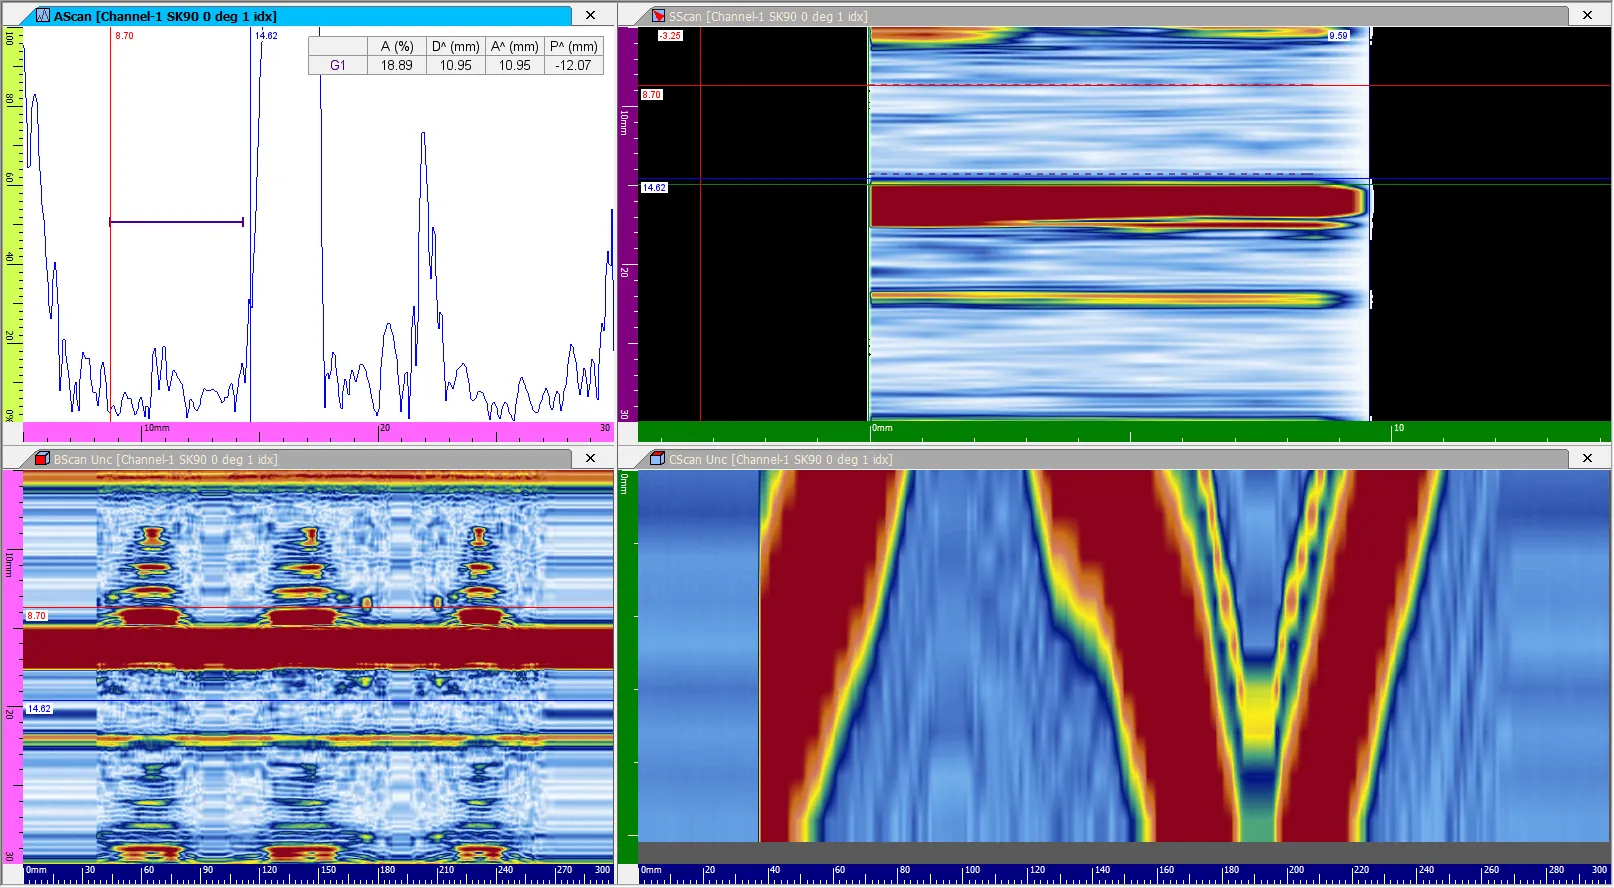
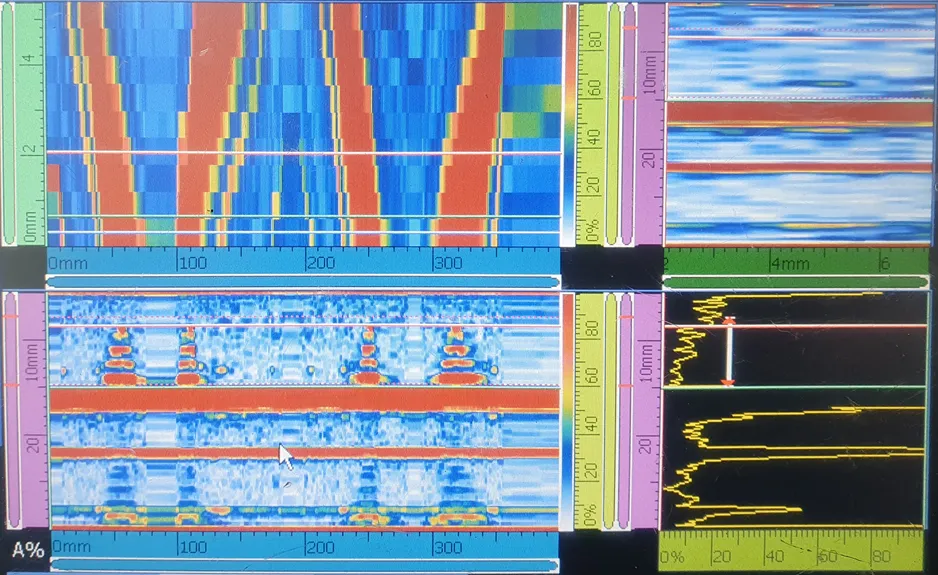
Section titled “Sectorial Image Comparison”- A direct visual comparison of the S-scan defect measurement images generated by the third-party equipment and the DEEPSOUND device.
DEEPSOUND Third-Party Equipment
Collected Sectorial Images
Section titled “Collected Sectorial Images”- A side-by-side comparison of the C-scan defect measurement images obtained from both the third-party equipment and the DEEPSOUND device.
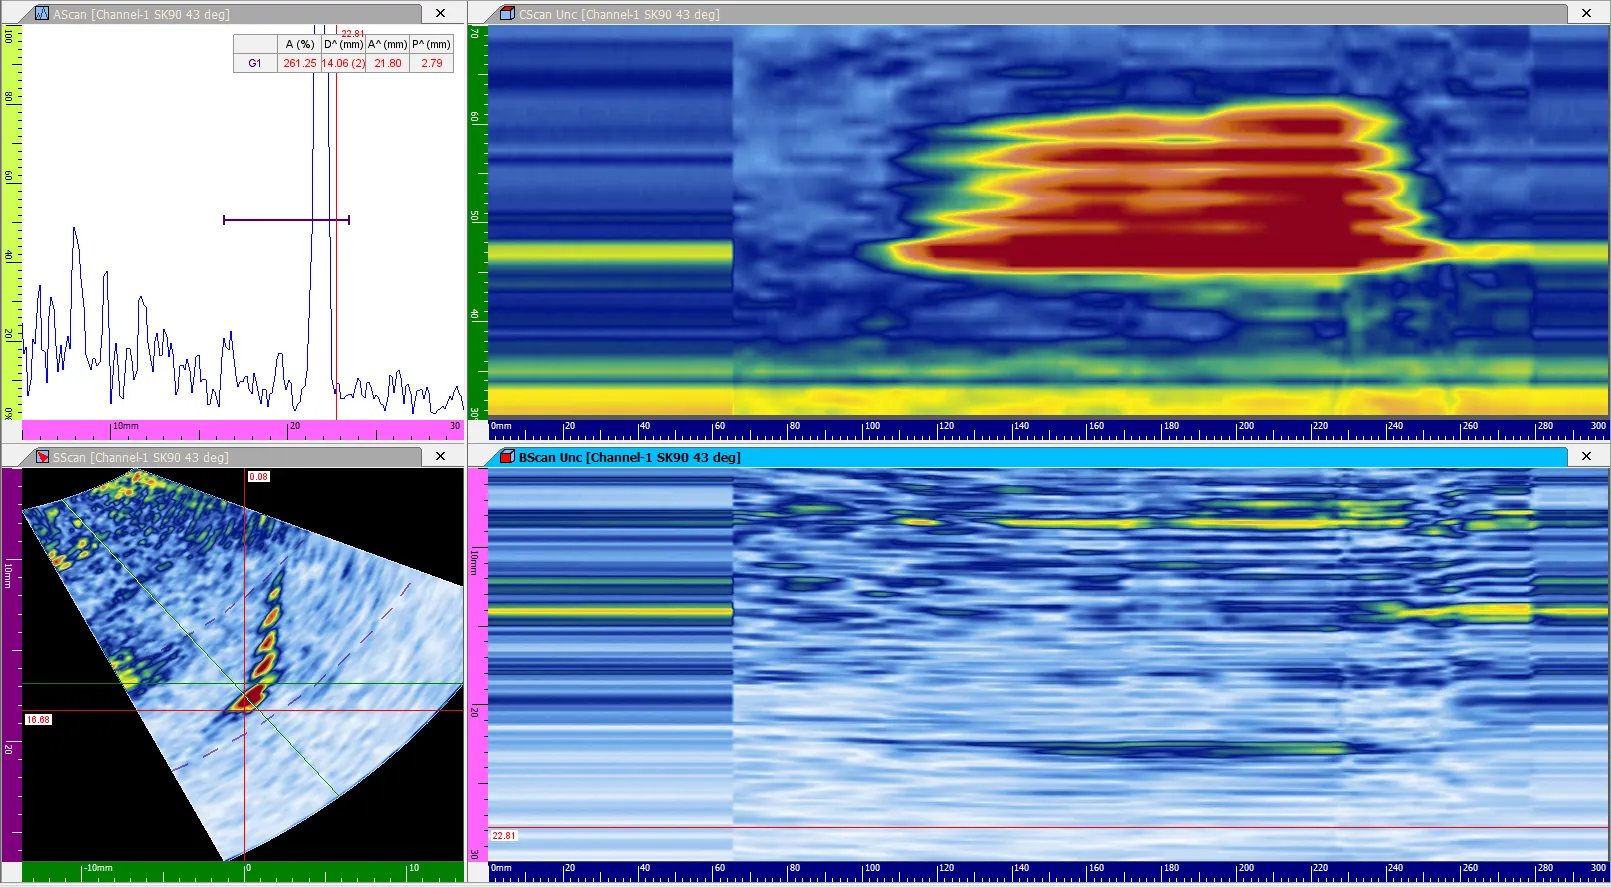
- DEEPSOUND
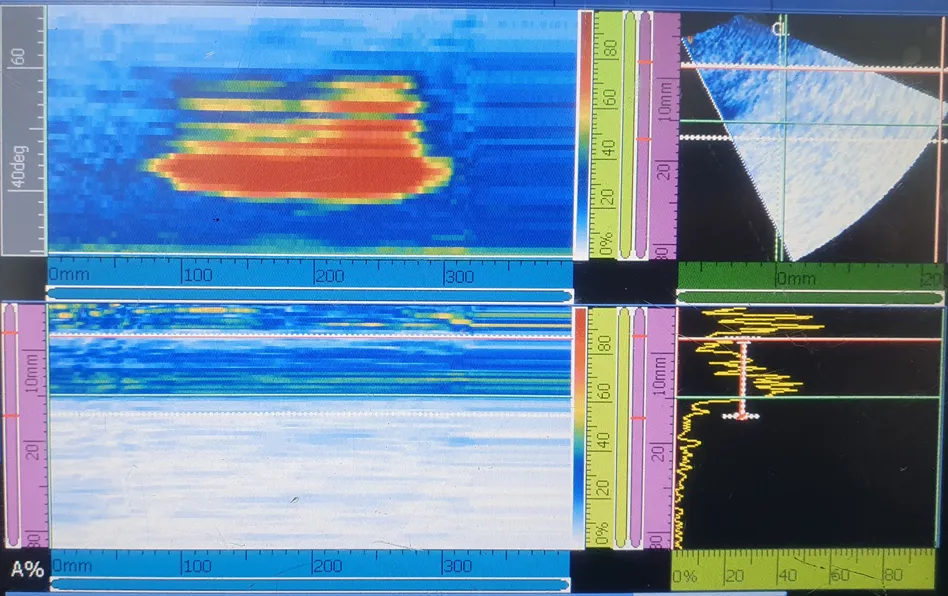
- Third-Party Equipment
Linear Scan: Settings & Image Comparison
Section titled “Linear Scan: Settings & Image Comparison”Linear Scan Settings
Section titled “Linear Scan Settings”- The Linear Scan parameter values for both the third-party equipment and the DEEPSOUND device were configured as detailed below:
Linear Image Comparison
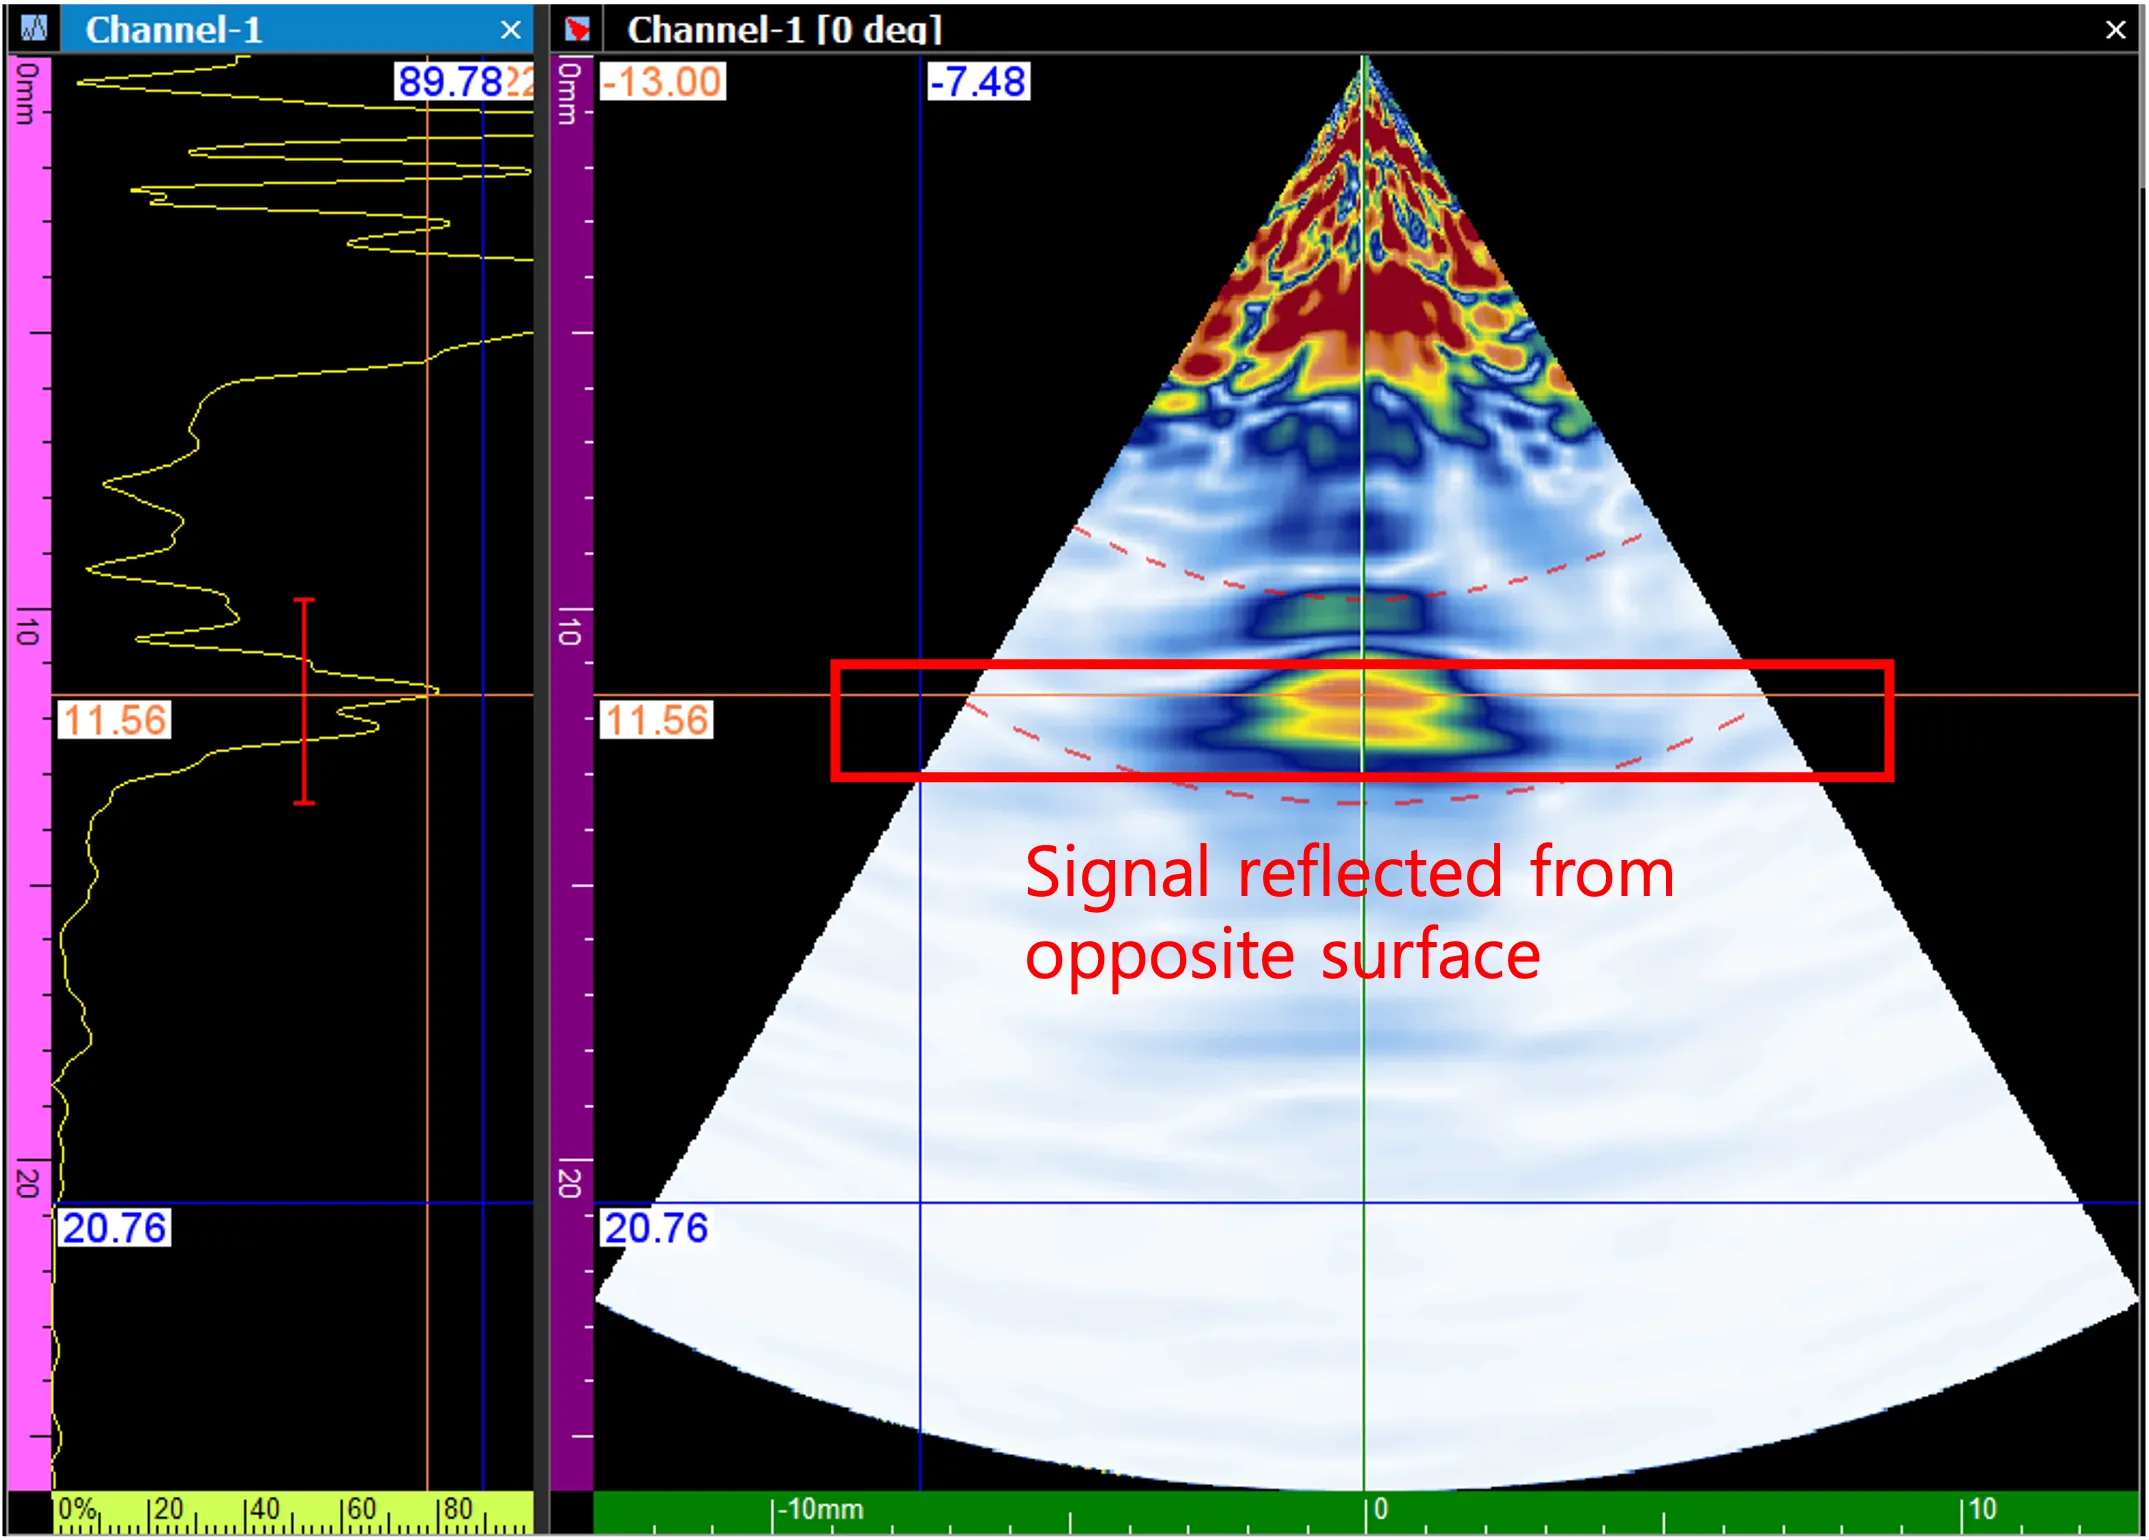
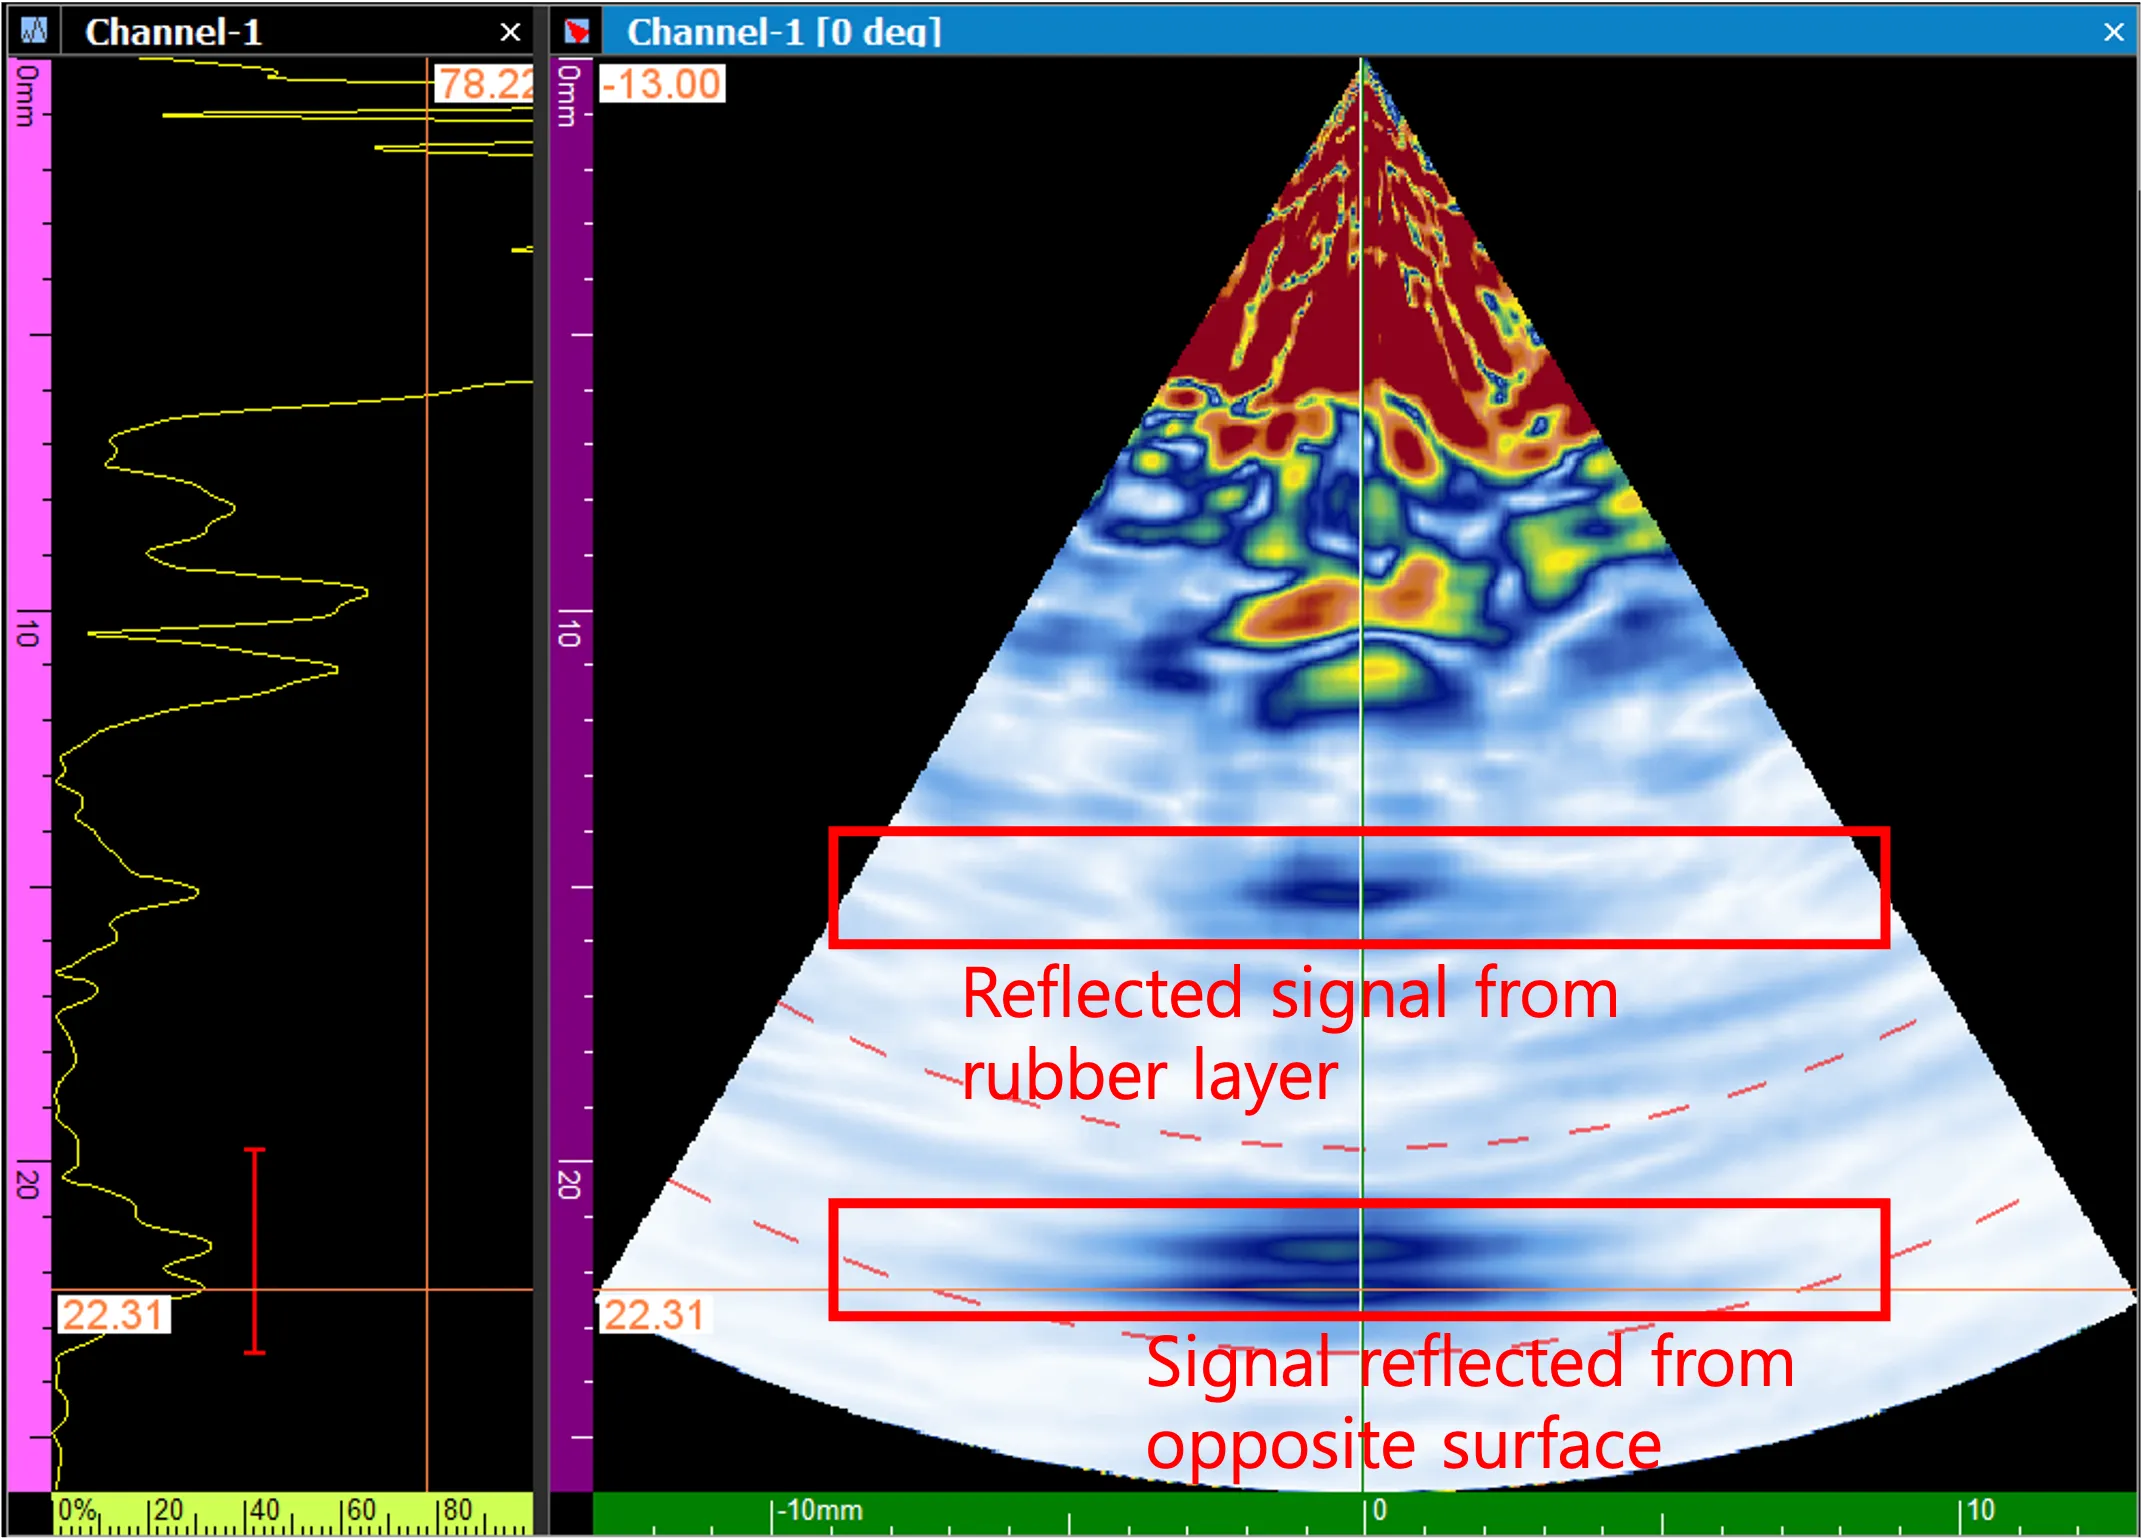
Section titled “Linear Image Comparison”- A direct visual comparison of the S-scan defect measurement images generated by the third-party equipment and the DEEPSOUND device.
Collected Linear Images
Section titled “Collected Linear Images”- A side-by-side comparison of the C-scan defect measurement images obtained from both the third-party equipment and the DEEPSOUND device.
- DEEPSOUND
- Third-Party Equipment
Conclusion
Section titled “Conclusion”- Both the DEEPSOUND and the third-party equipment were used to systematically inspect the prepared test sample under identical parameter settings.
- Both systems successfully produced highly comparable sectorial and linear scan images, resulting in consistent data outputs.
- The initial expectation was for the S-scan images to display the entire lateral profile of the defects; however, the resulting images predominantly highlighted the top edges of the flaws.
- The linear scan images proved more effective at clearly illustrating the widest cross-section of the sample.