Composite Material Defect Detection
Section titled “Composite Material Defect Detection”- The objective of this test is to verify whether the DEEPSOUND equipment can successfully detect underlying defects within the composite material.
Test Samples
Section titled “Test Samples”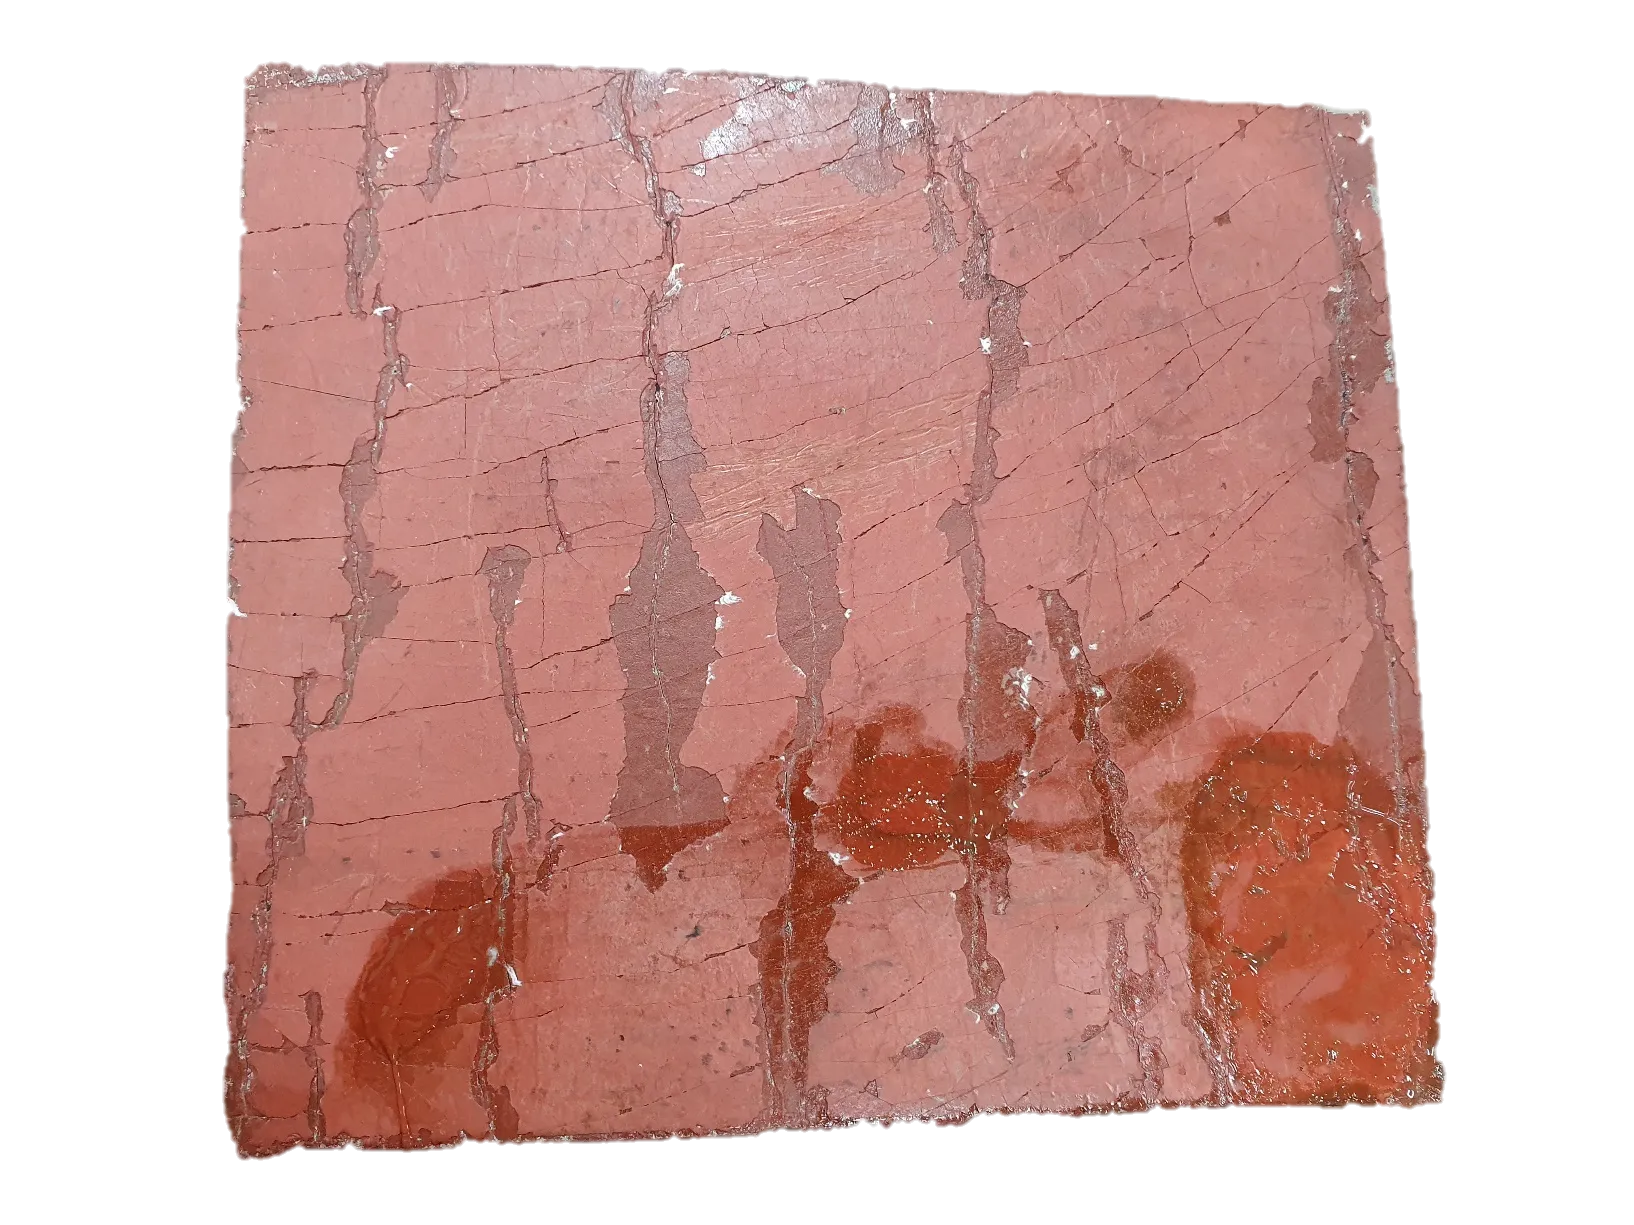
- Front Side
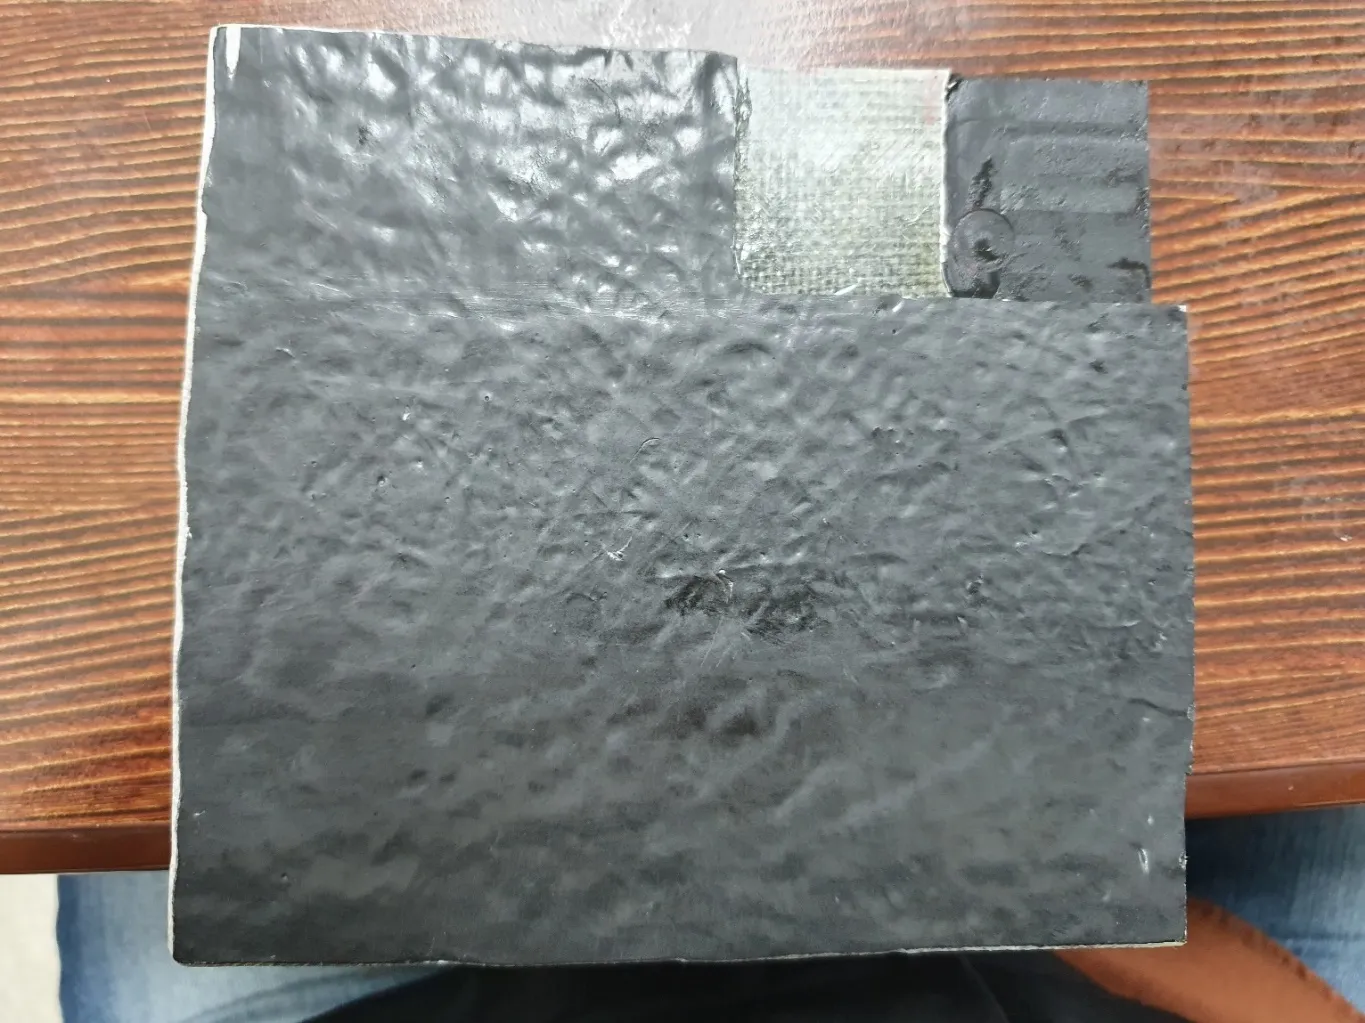
- Back Side
Measuring Method
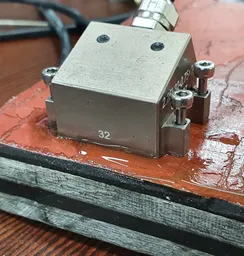
Section titled “Measuring Method”- Measurements are conducted by placing the probe directly onto the sample without a wedge. The goal is to determine if points of varying sizes (Point #1 to Point #3) can be distinctly identified in the PAUT S-scan.
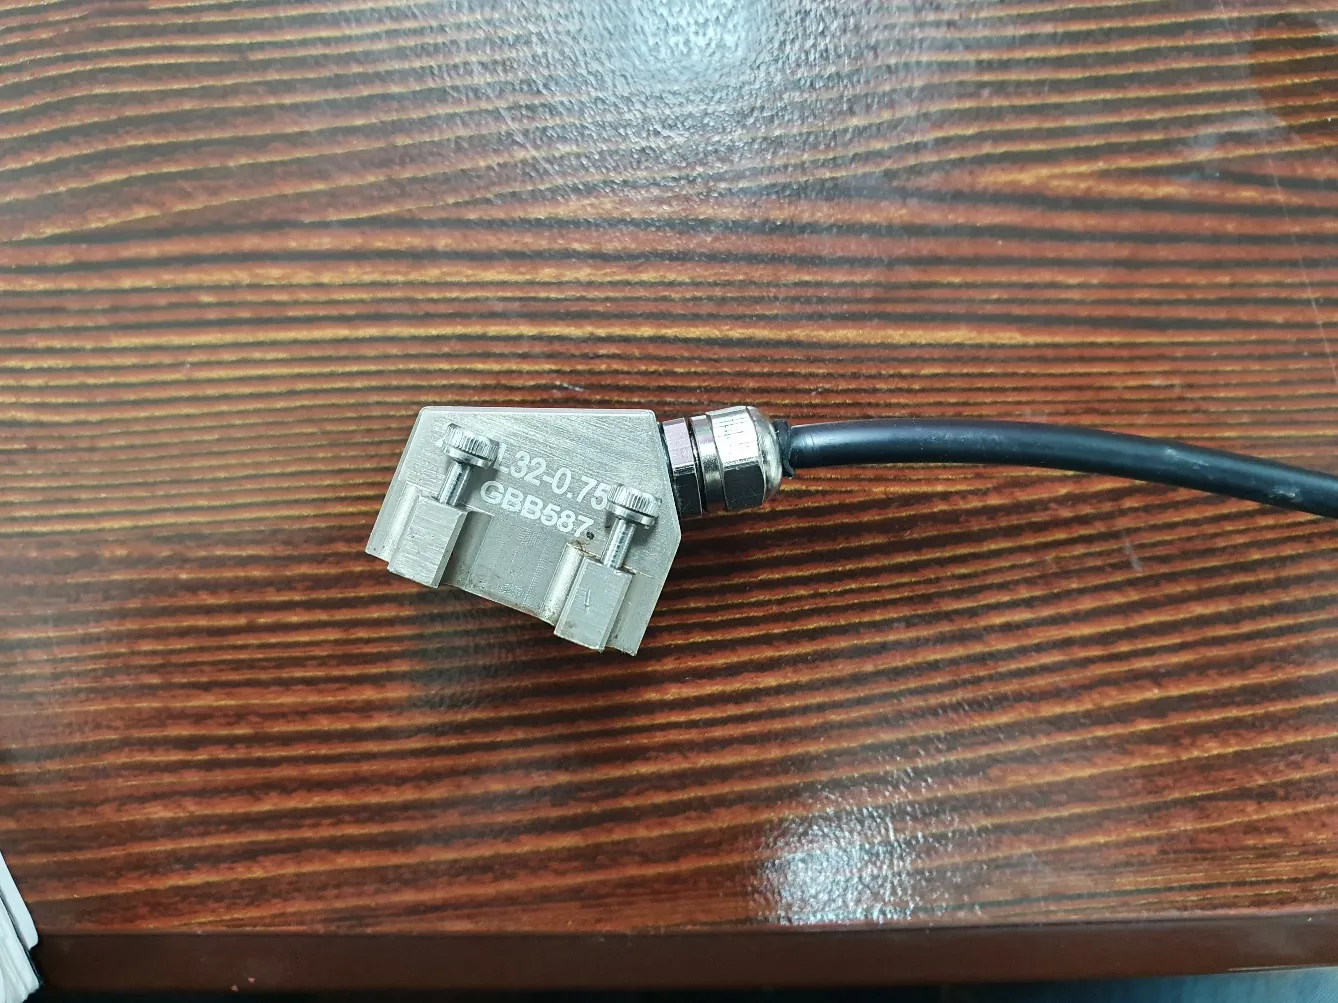
- Equipment: 2.25 MHz PAUT Probe
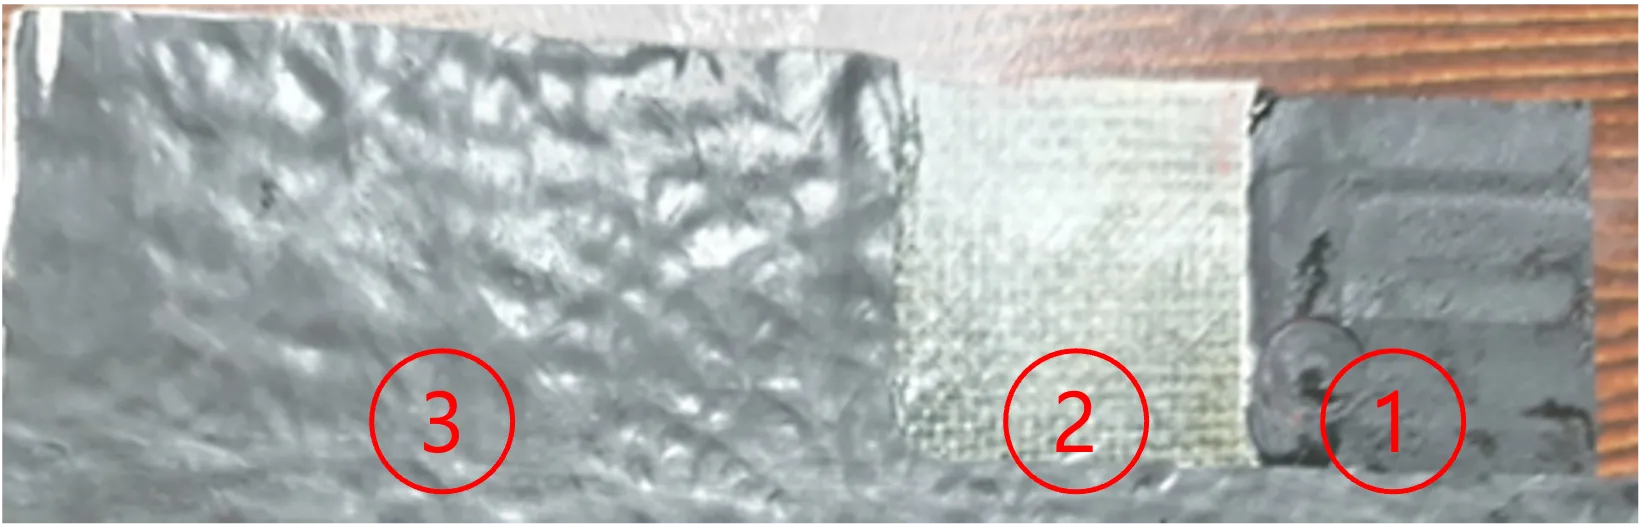
- Marking Each Signal Point
Inspection Point #1
Section titled “Inspection Point #1”- Actual Thickness of Point #1: Approximately 7.00 mm
- Detected Position of the Reflected Signal: 6.13 mm
- Observation: The S-scan clearly displays the ultrasonic signal reflecting off the intermediate rubber layer.
- S-Scan Image of Point #1
Inspection Point #2
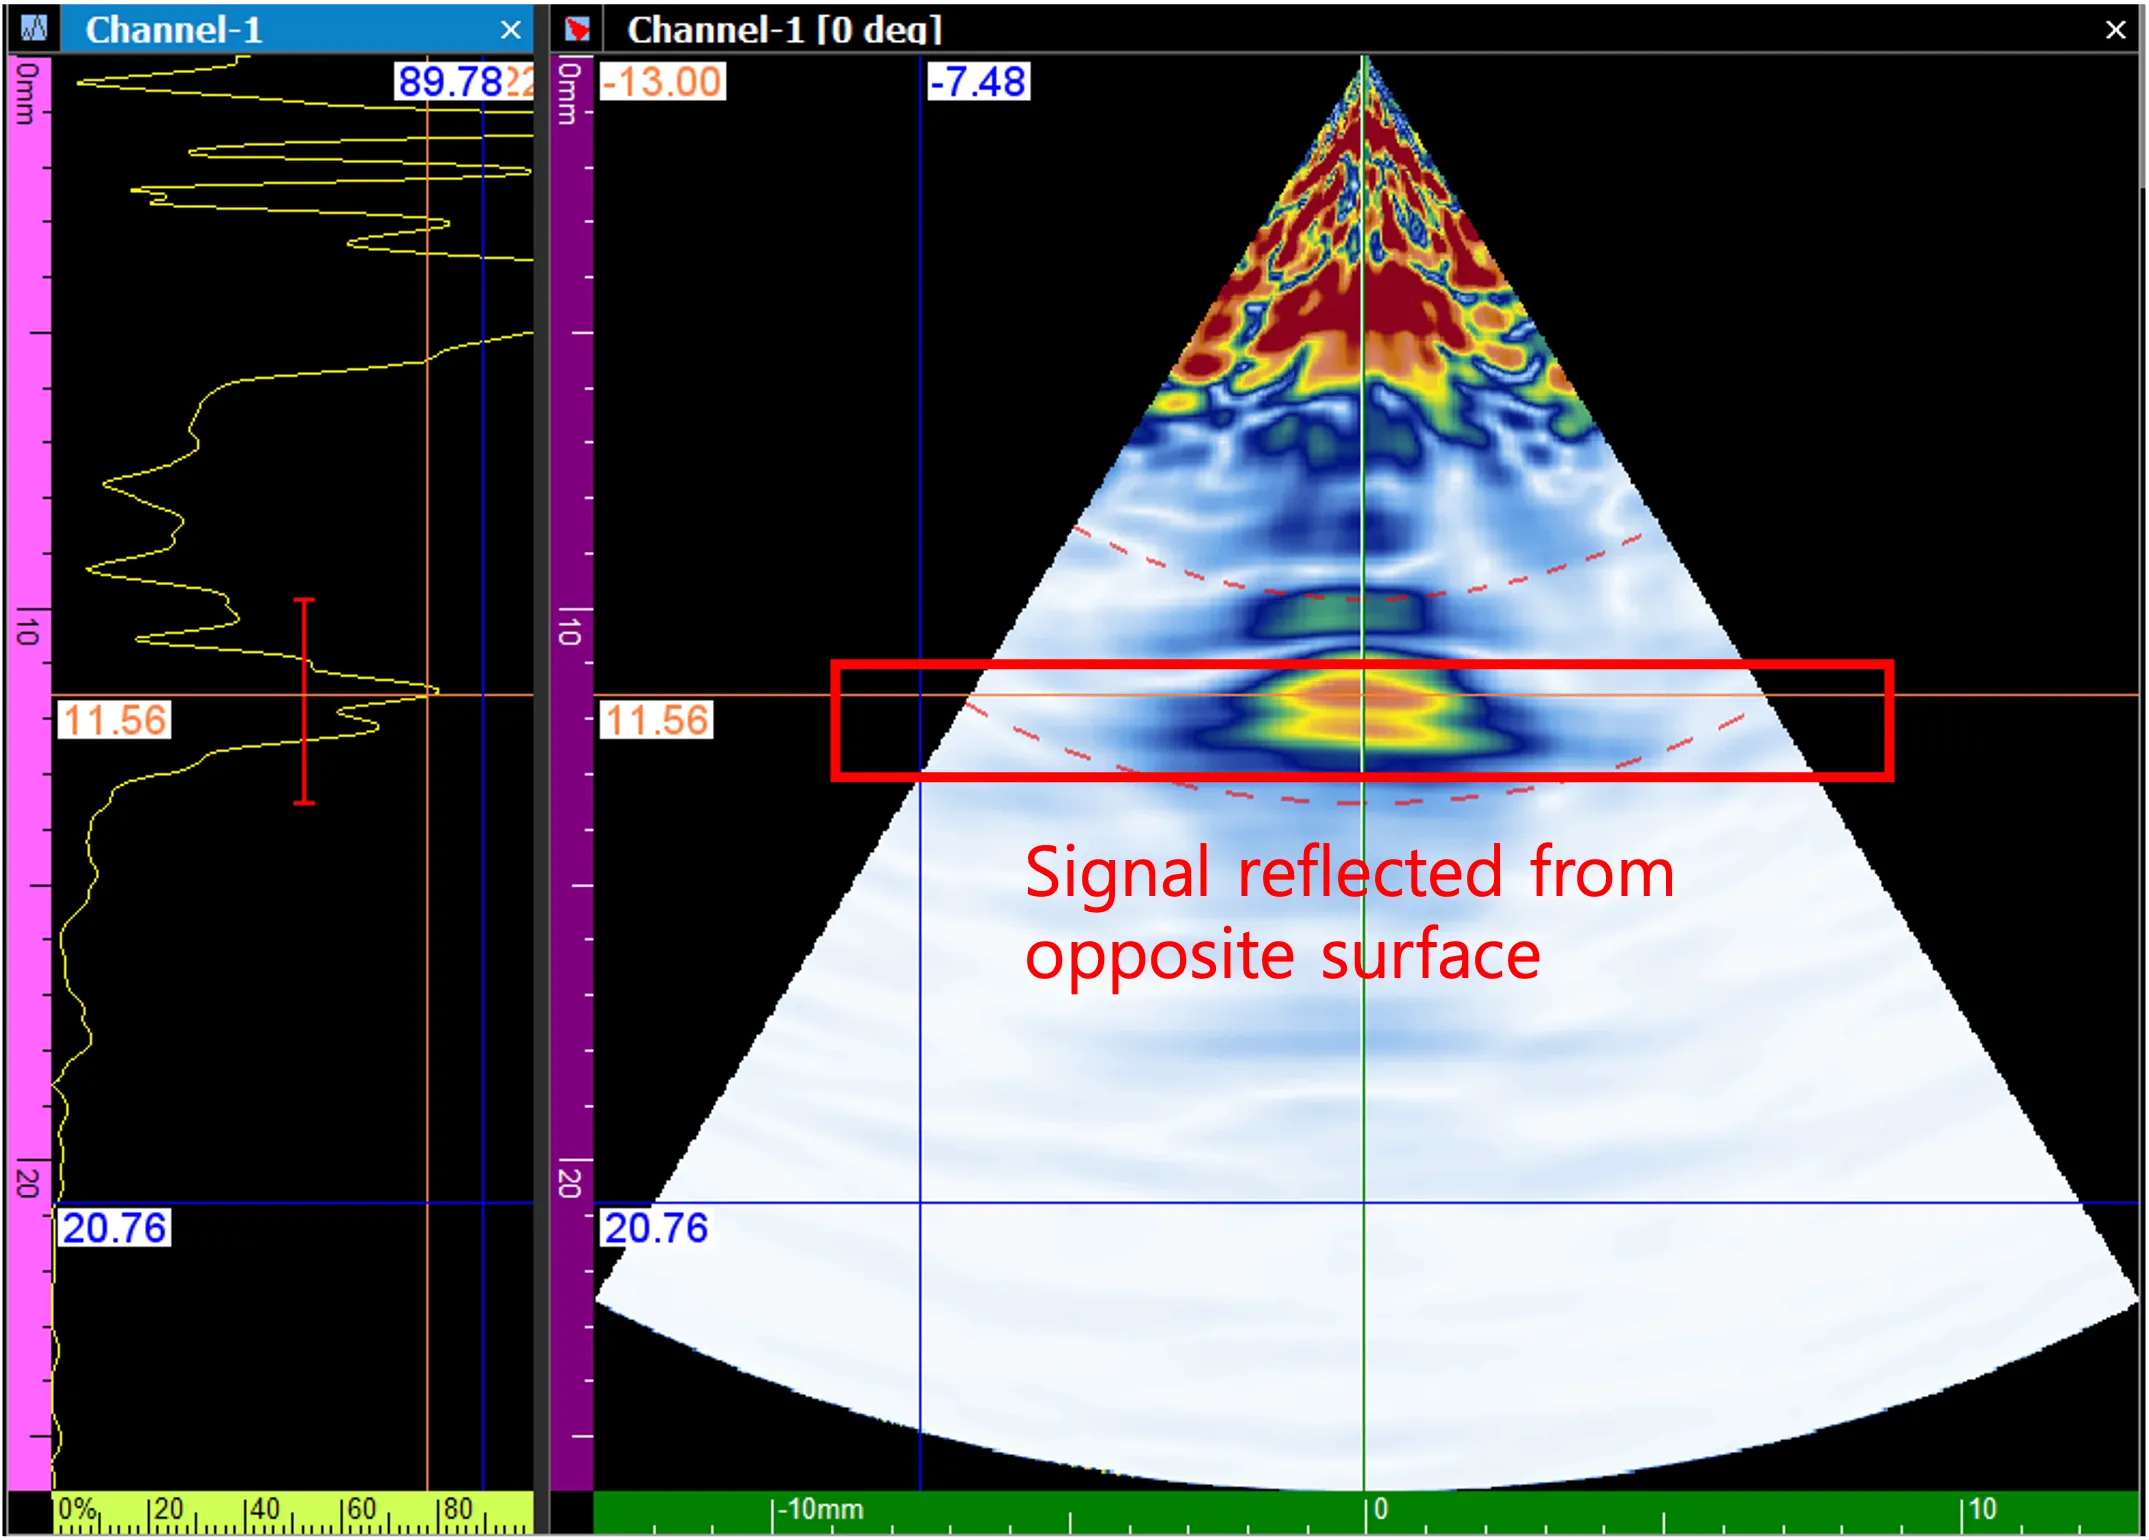
Section titled “Inspection Point #2”- Actual Thickness of Point #2: Approximately 11.00 mm
- Detected Position of the Reflected Signal: 10.38 mm
- Observation: A clear reflected signal is visible at the designated depth.
- S-Scan Image of Point #2
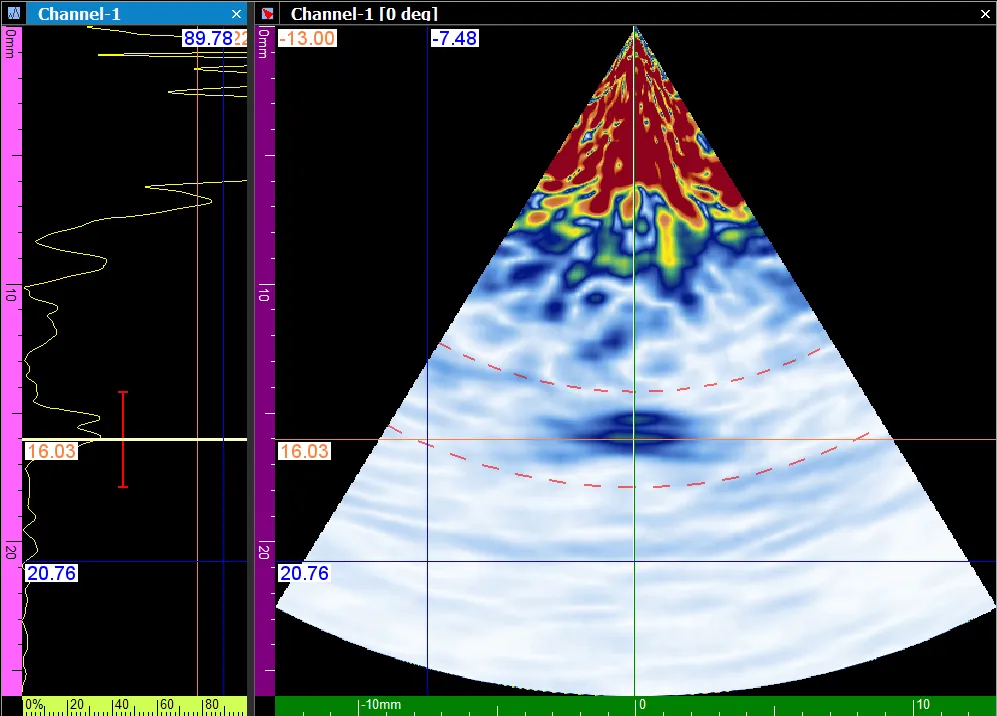
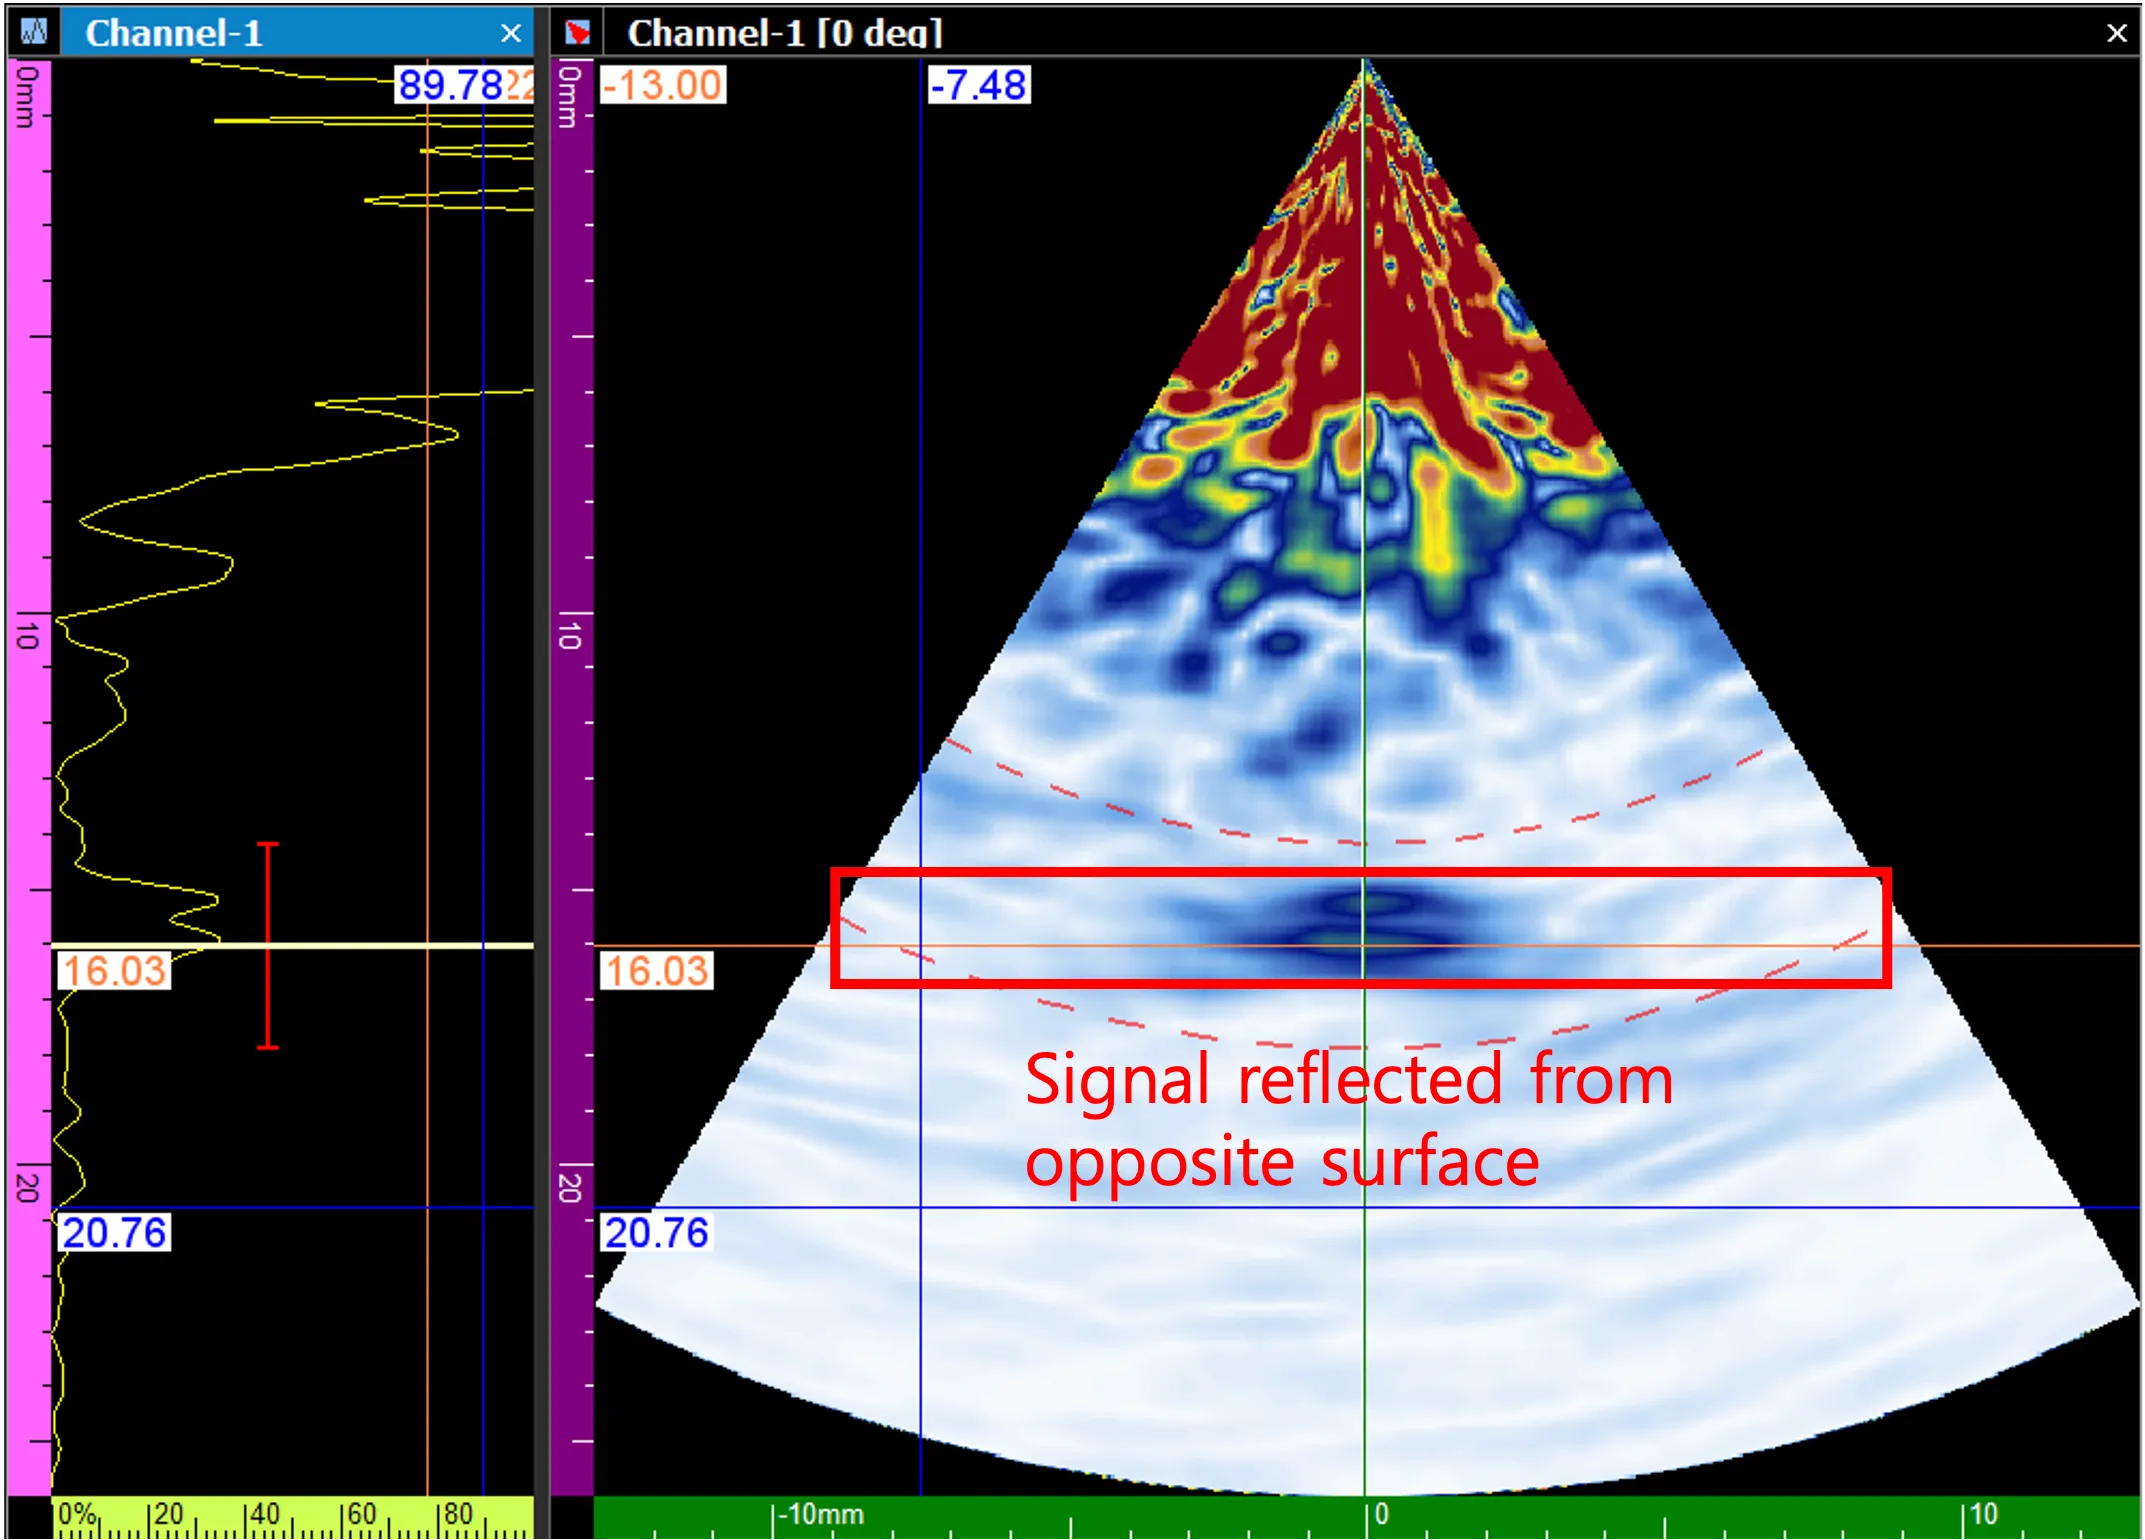
Inspection Point #3
Section titled “Inspection Point #3”- Actual Thickness of Point #3: Approximately 23.00 mm
- Detected Position of the Reflected Signal: 22.31 mm
- Observation: The S-scan clearly displays the ultrasonic signal reflecting off the intermediate rubber layer at its maximum thickness.
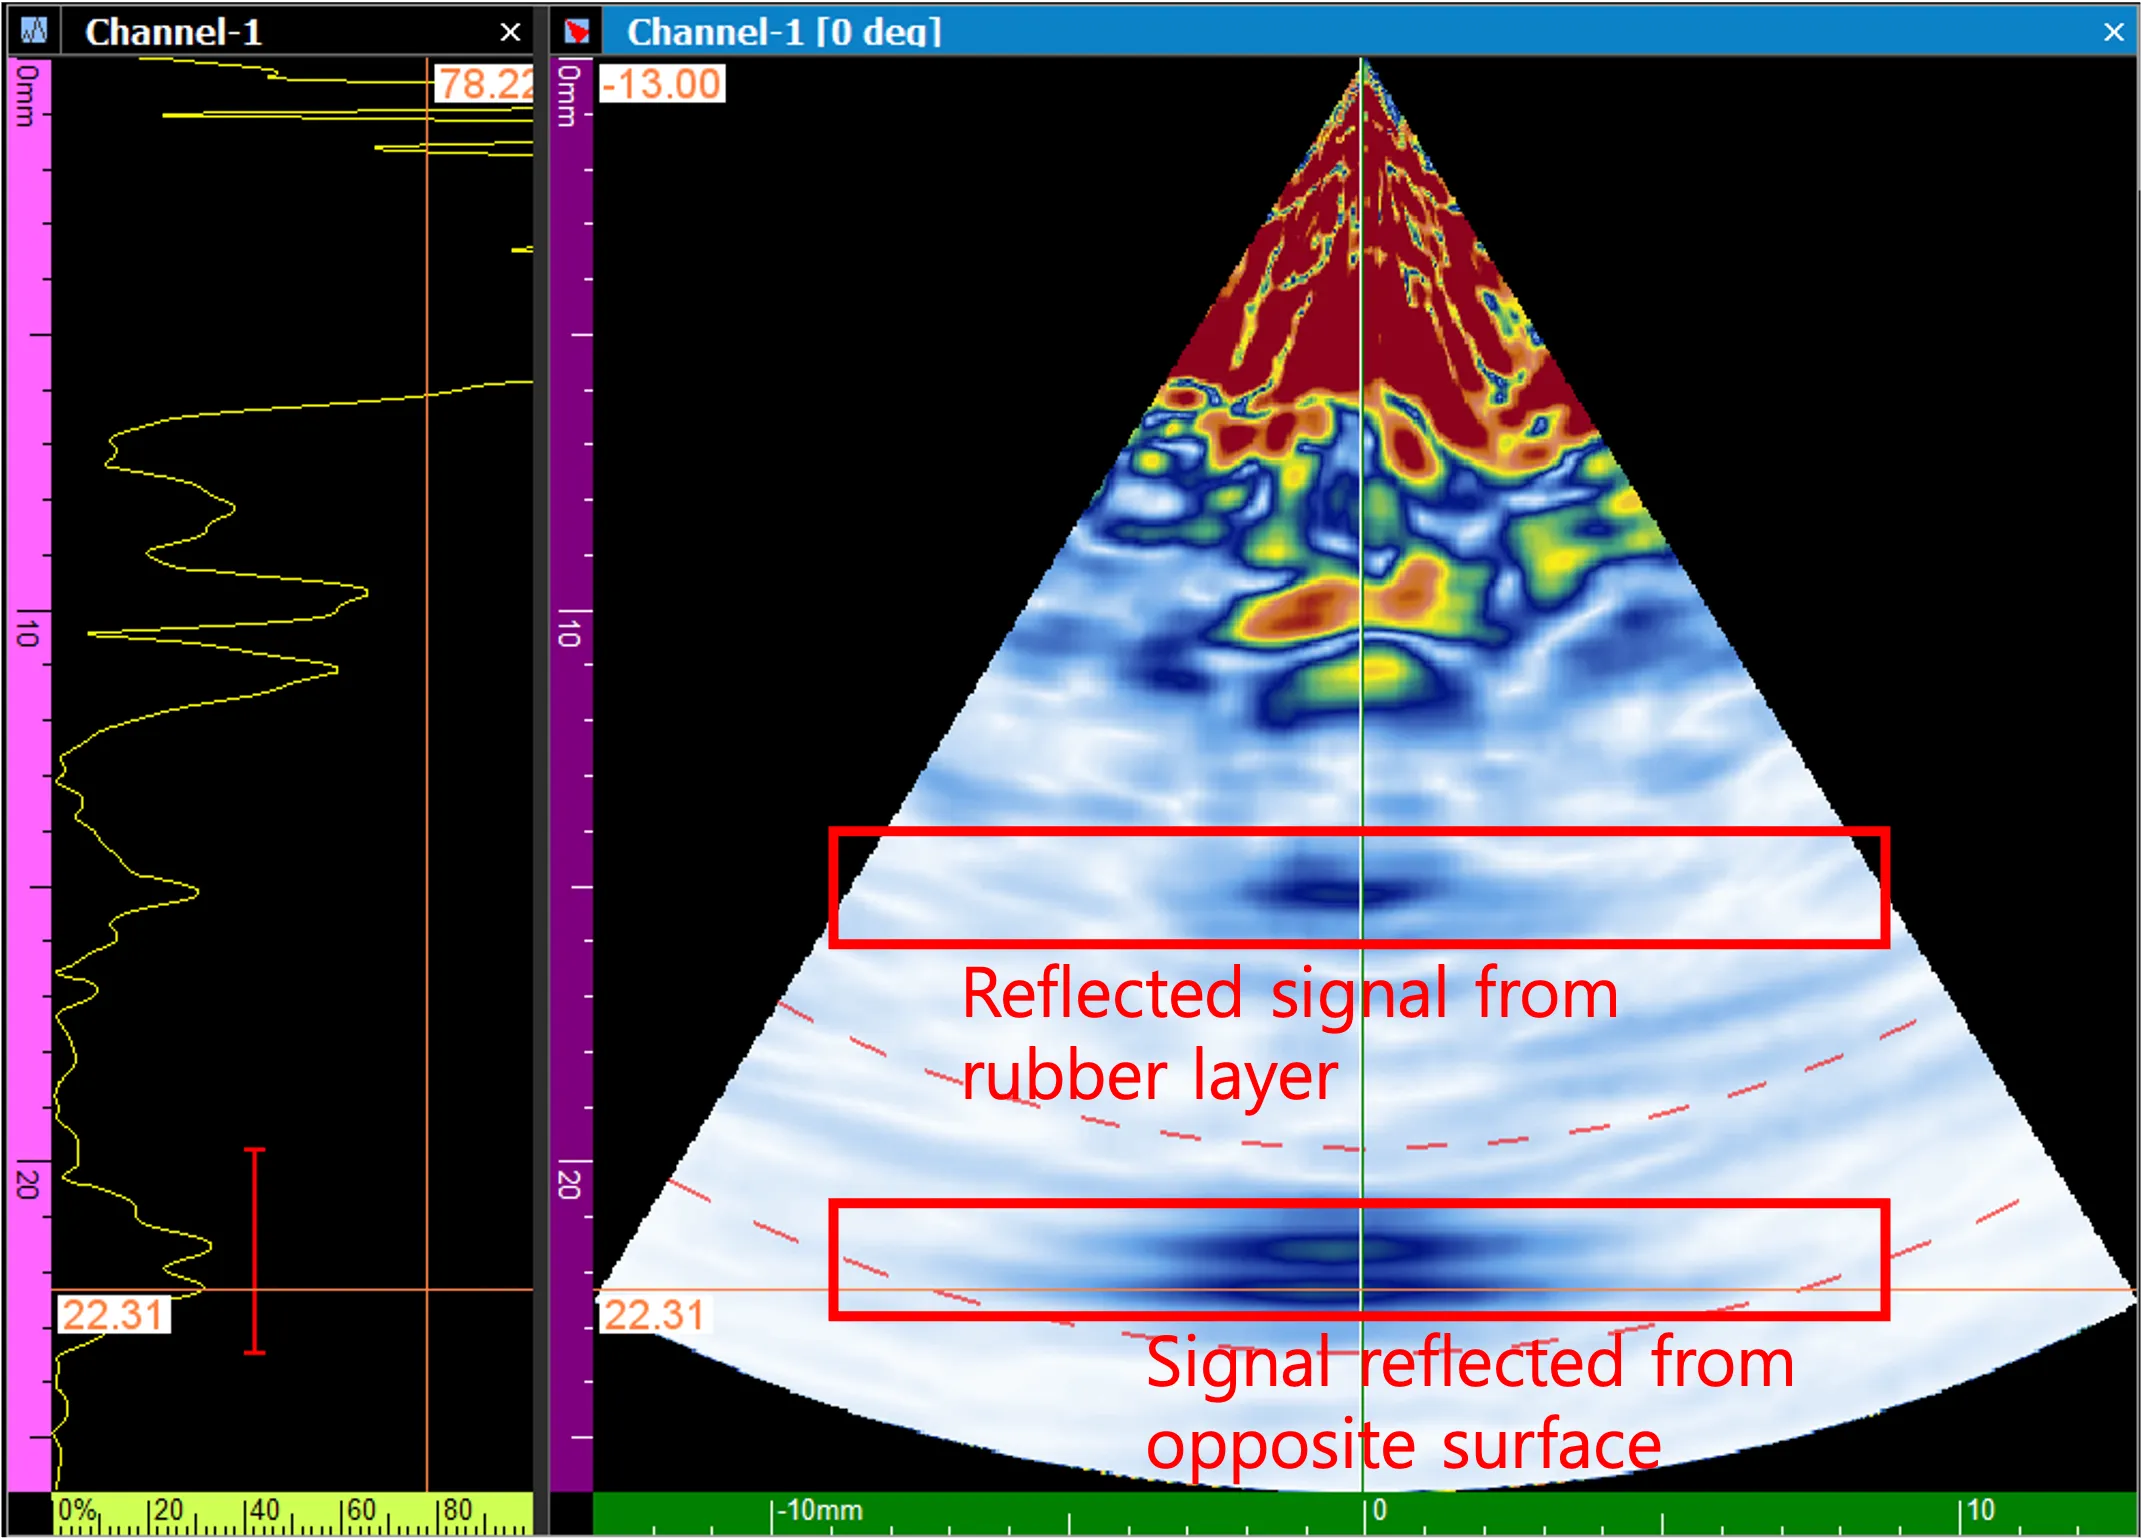 - S-Scan Image of Point #3
Evaluation & Conclusion
Section titled “Evaluation & Conclusion”- The test successfully confirmed that explicit reflected signals could be detected at each designated inspection point within the composite specimen.
- The inspection was conducted using a probe with a frequency of 2.25 MHz. For optimal results in highly attenuating materials, we recommend utilizing a probe with a frequency lower than 2.25 MHz.
- Because composite specimens inherently cause severe attenuation of ultrasonic waves, images can appear somewhat blurred. Measuring alongside a known defect-free reference sample is strongly advised for comparative analysis.
- When inspecting the maximum thickness at Point #3, identifying the signal reflecting off the far back-wall proved challenging. (Recommendation: Increase the transmission voltage of the probe to proactively compensate for severe signal attenuation.)
- Ultimately, this ultrasonic testing comprehensively verified the presence of internal structural changes. Employing a lower frequency probe is expected to yield noticeably sharper and cleaner images.