Corrosion Data Analysis DSViewer
Section titled “Corrosion Data Analysis DSViewer”- A comprehensive comparison of corrosion map analysis performance between DSViewer (DEEPSOUND) and third-party analysis programs.
Software Used
Section titled “Software Used”- Using the collected Corrosion Map data, the performance of the two analysis programs is compared by examining their respective Colormaps and scan-specific images.
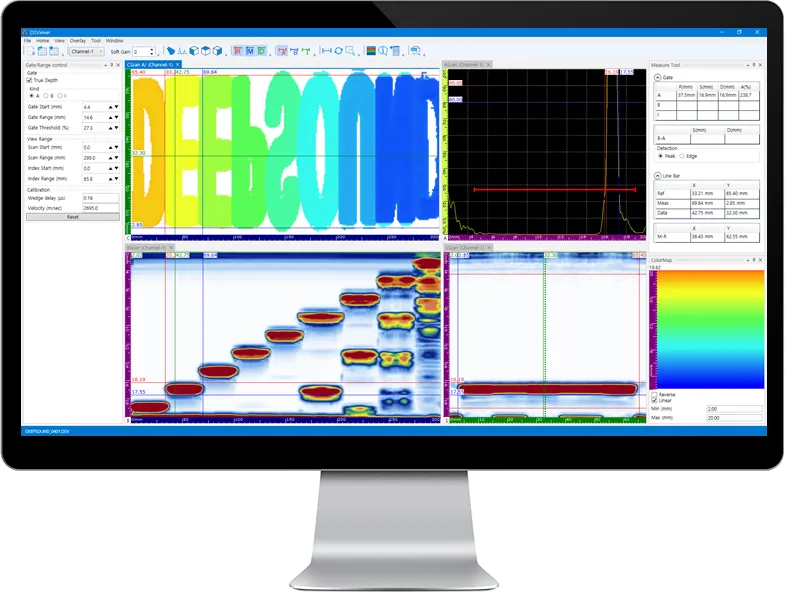
- DSViewer DEEPSOUND Program
- Third-Party Equipment Program
Comparing Data #1
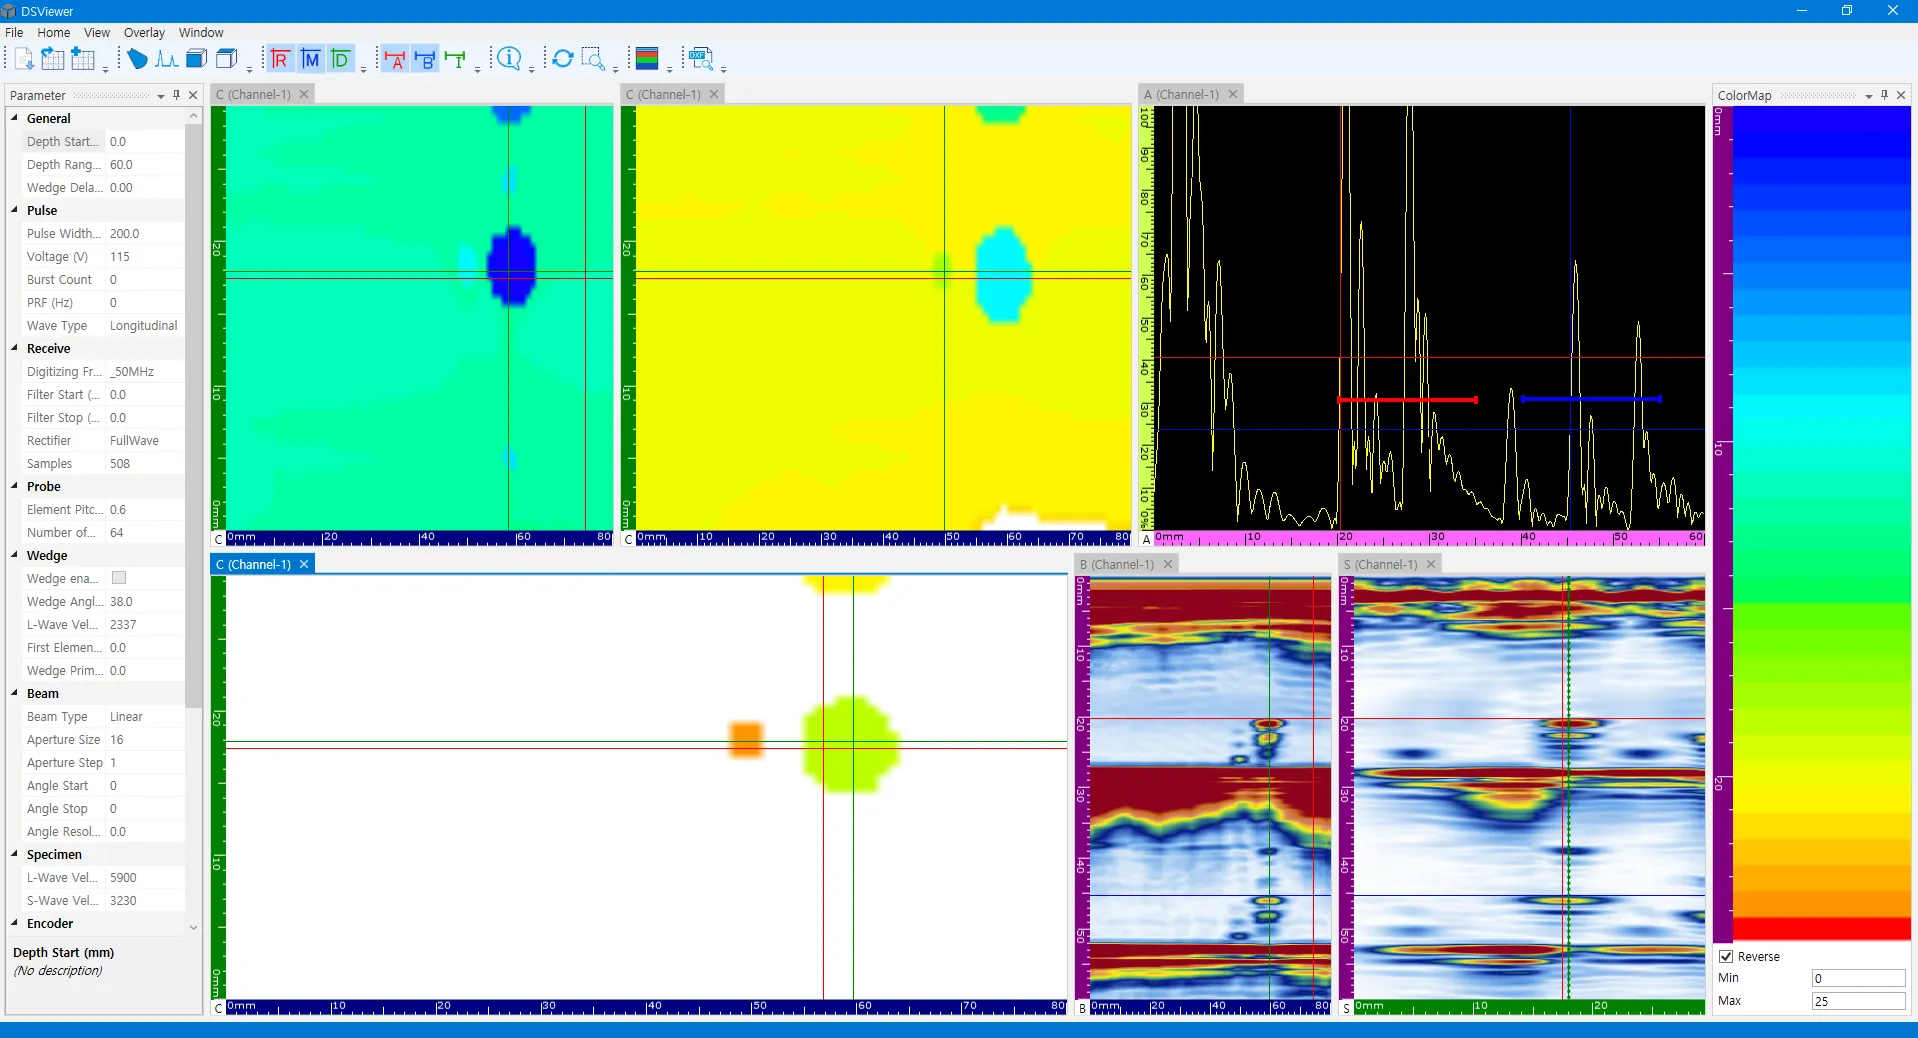
Section titled “Comparing Data #1”- Analysis #1 compares the initial defects identified immediately upon loading. By adjusting the data cursor, users can clearly observe the A-scan signal and pinpoint the exact location.
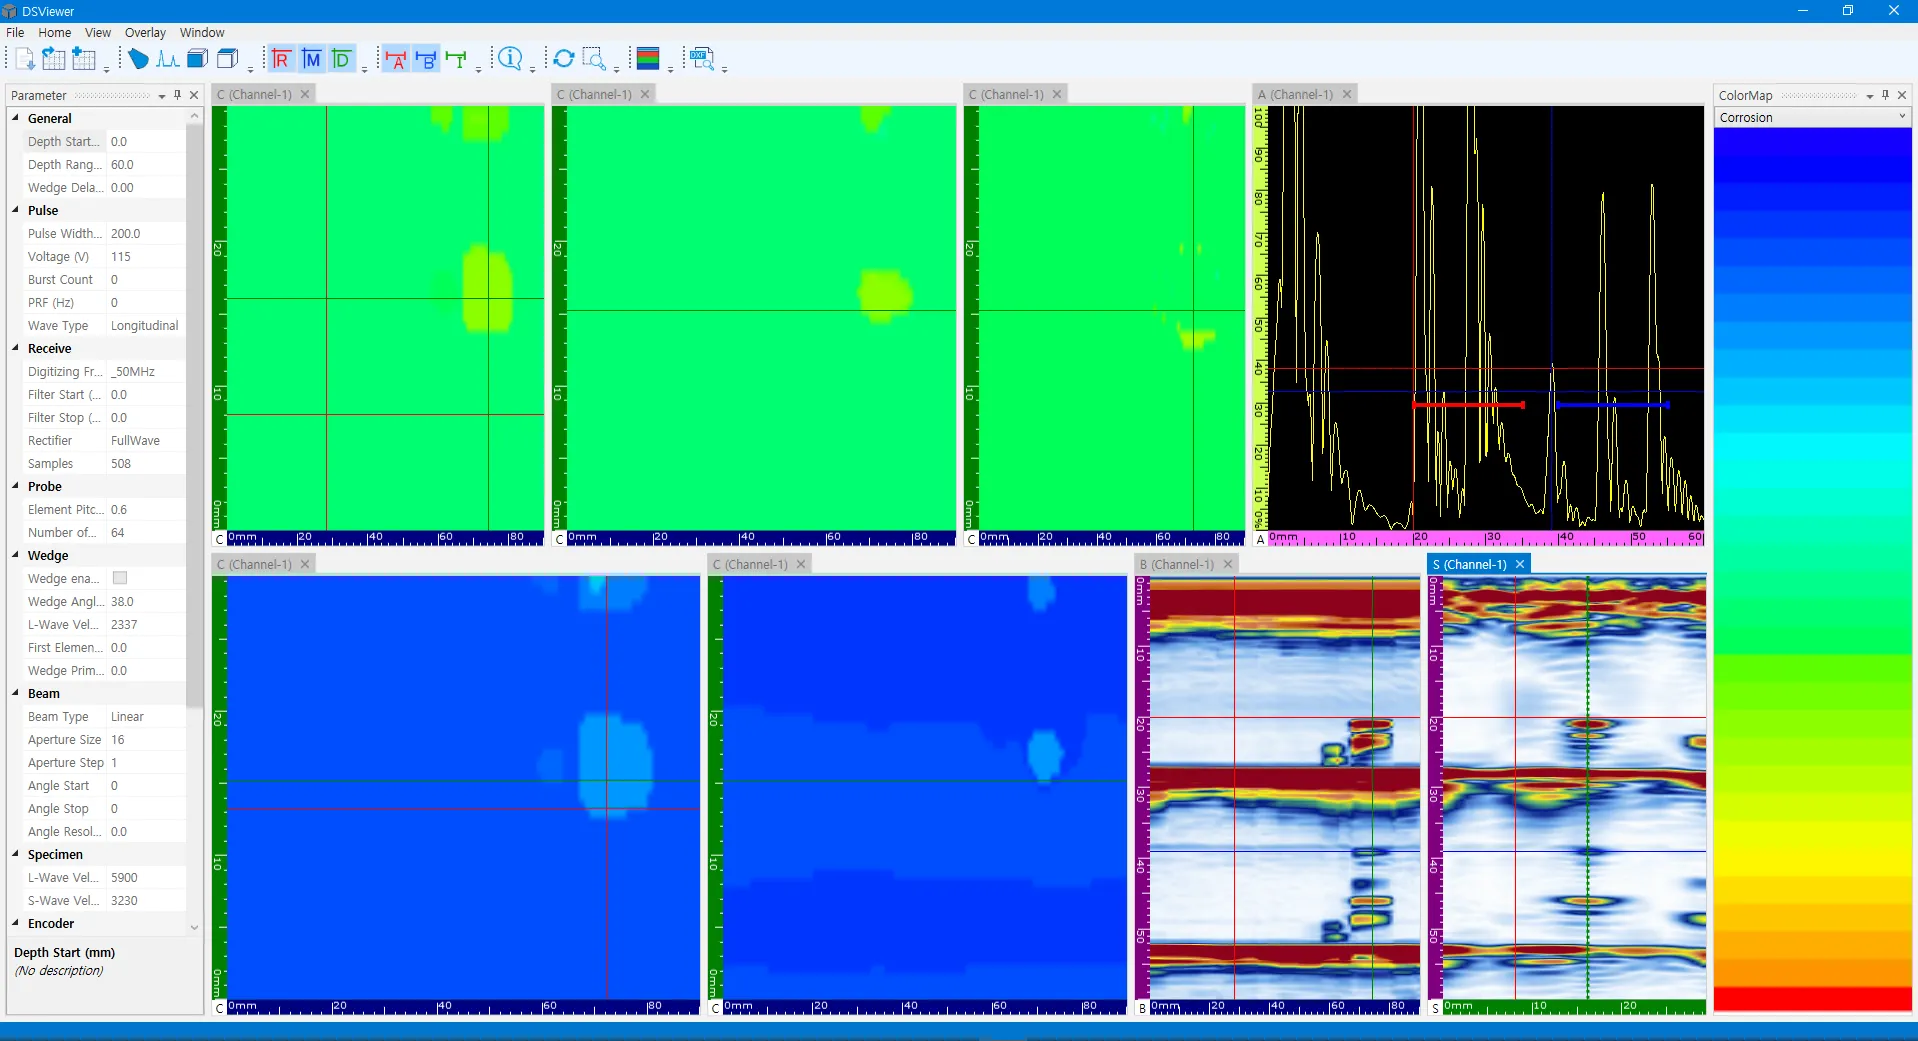
- DSViewer Interface
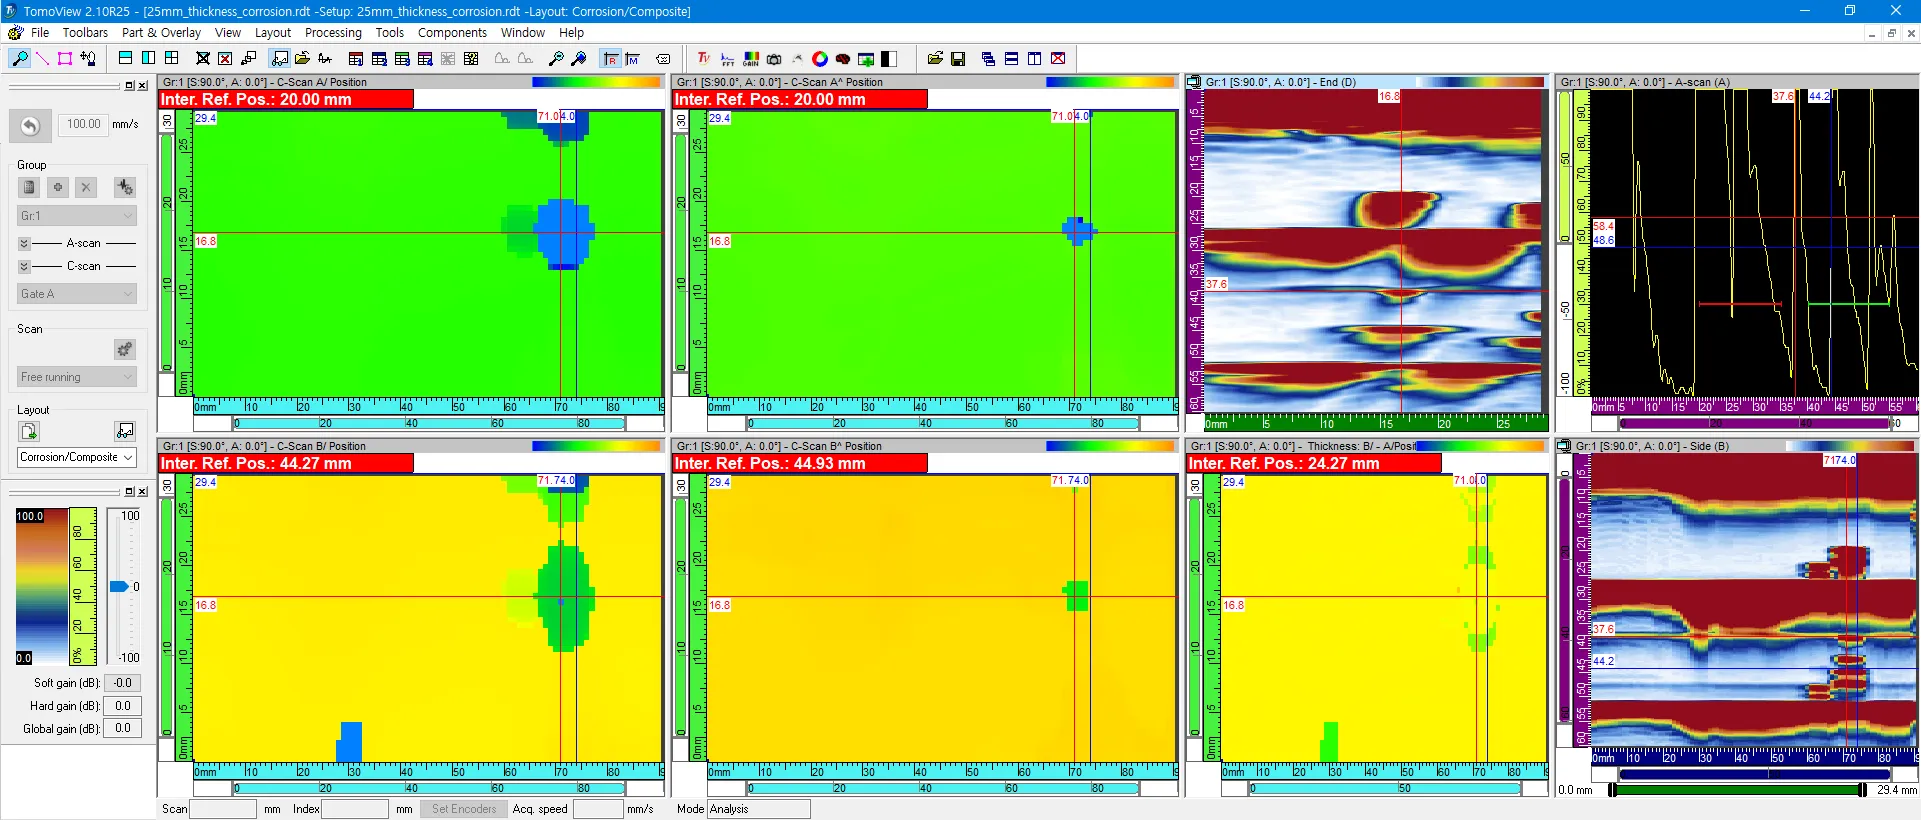
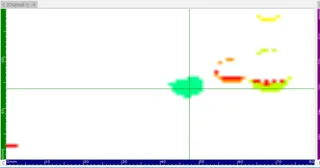
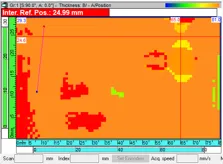
- Third-Party Interface
Comparing Data #2
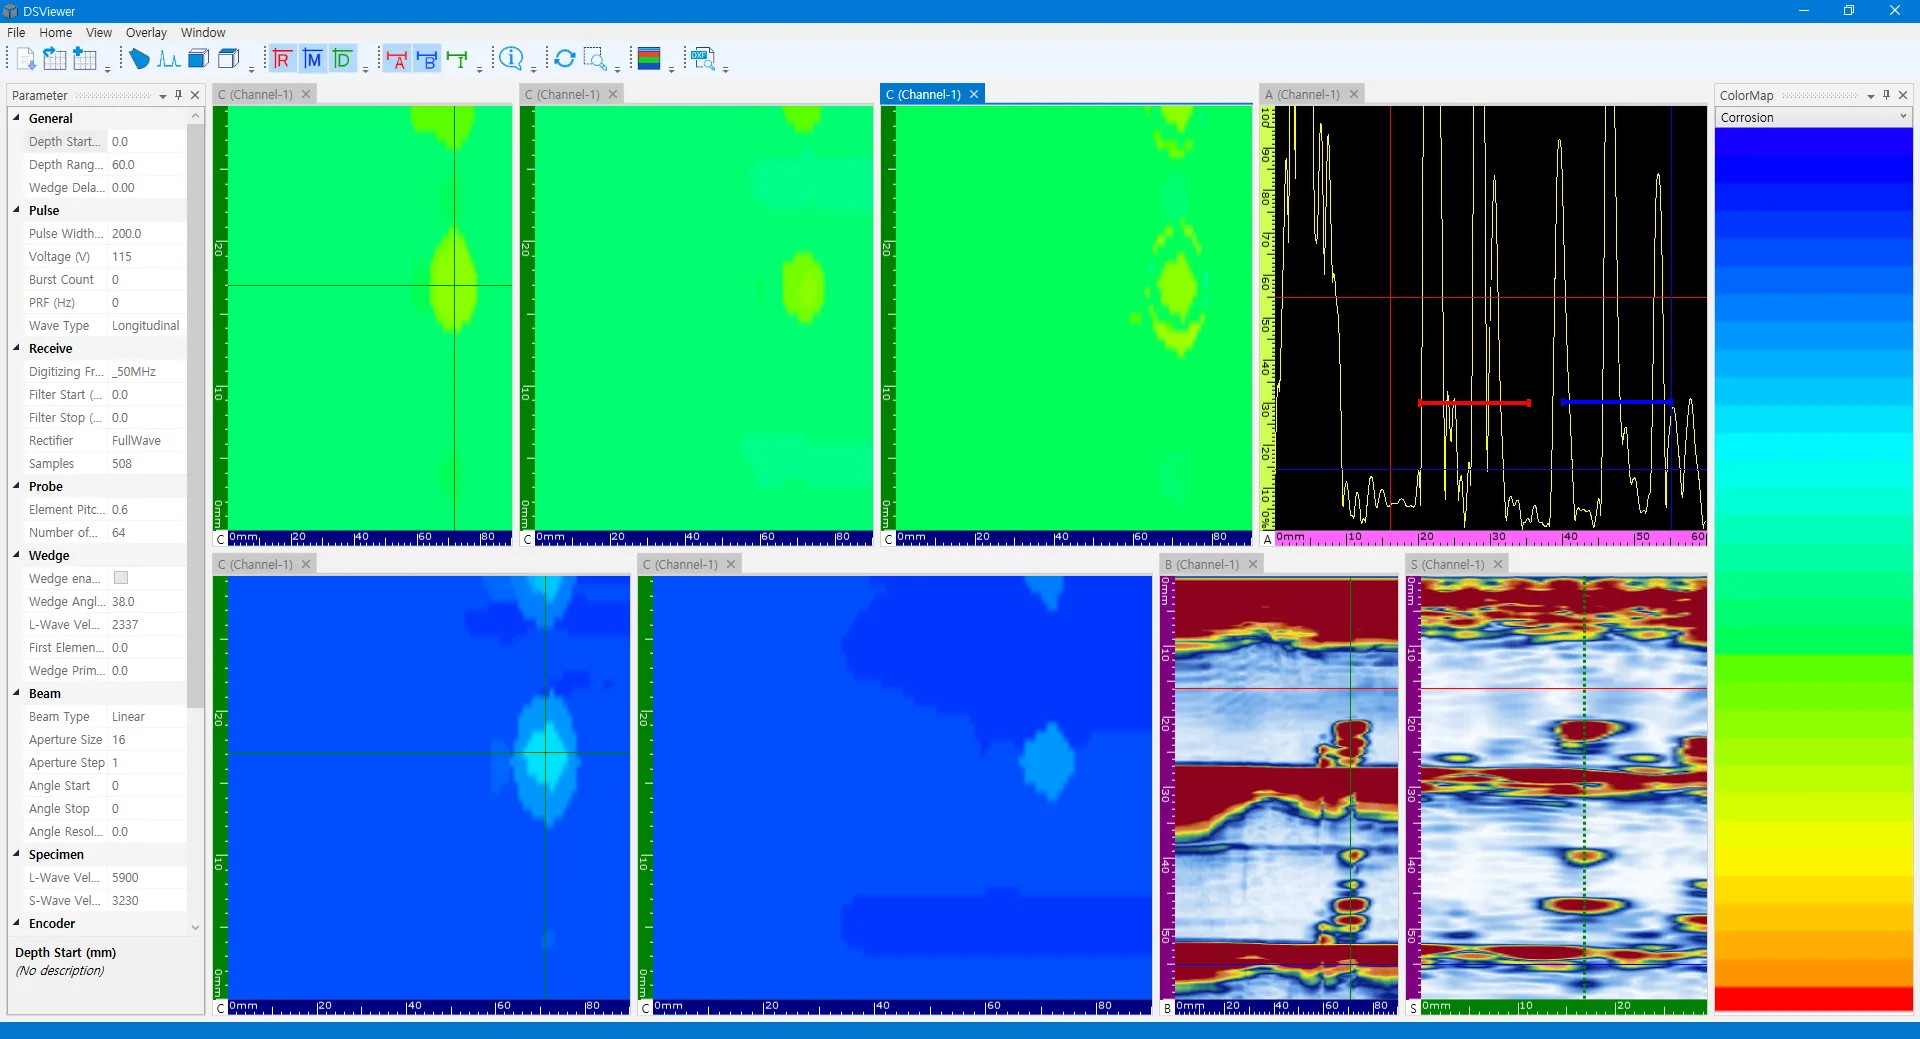
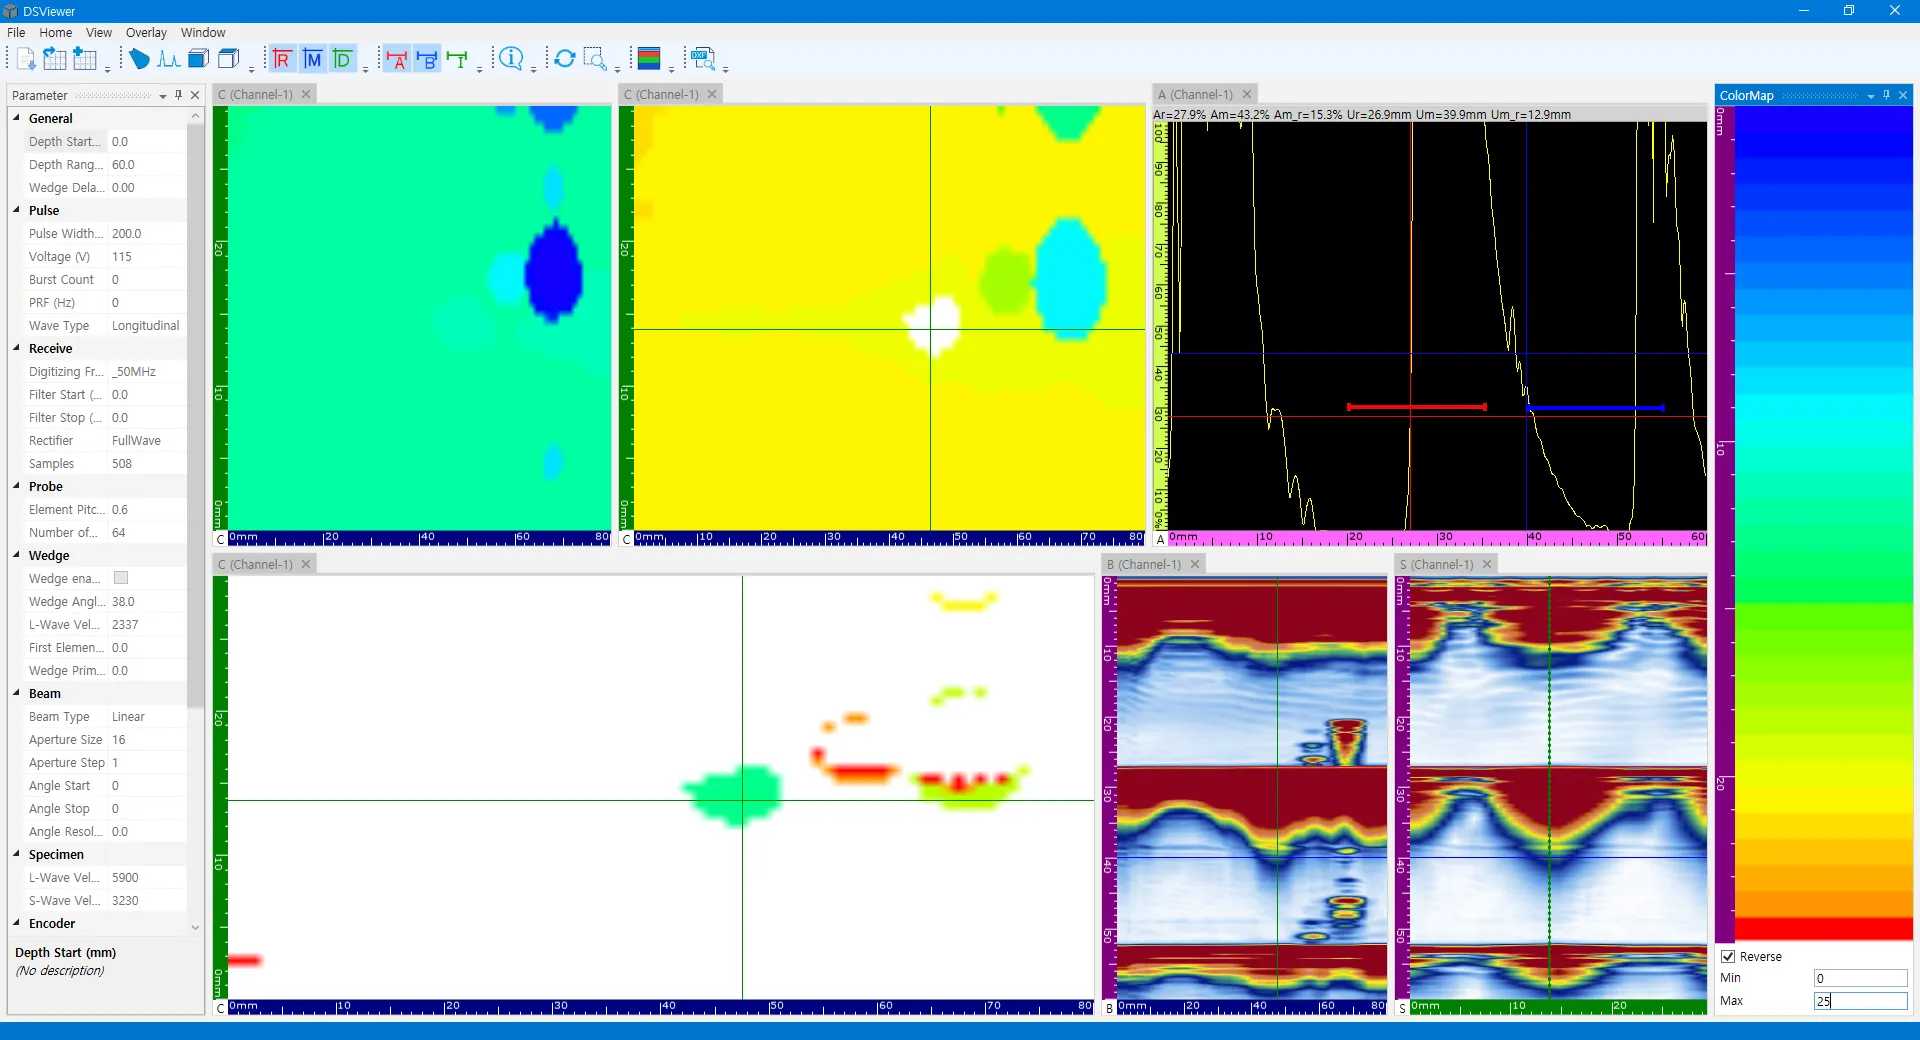
Section titled “Comparing Data #2”- Comparison focusing on signal clarity and defect boundary detection.
- DSViewer Interface
- Third-Party Interface
Comparing Data #3
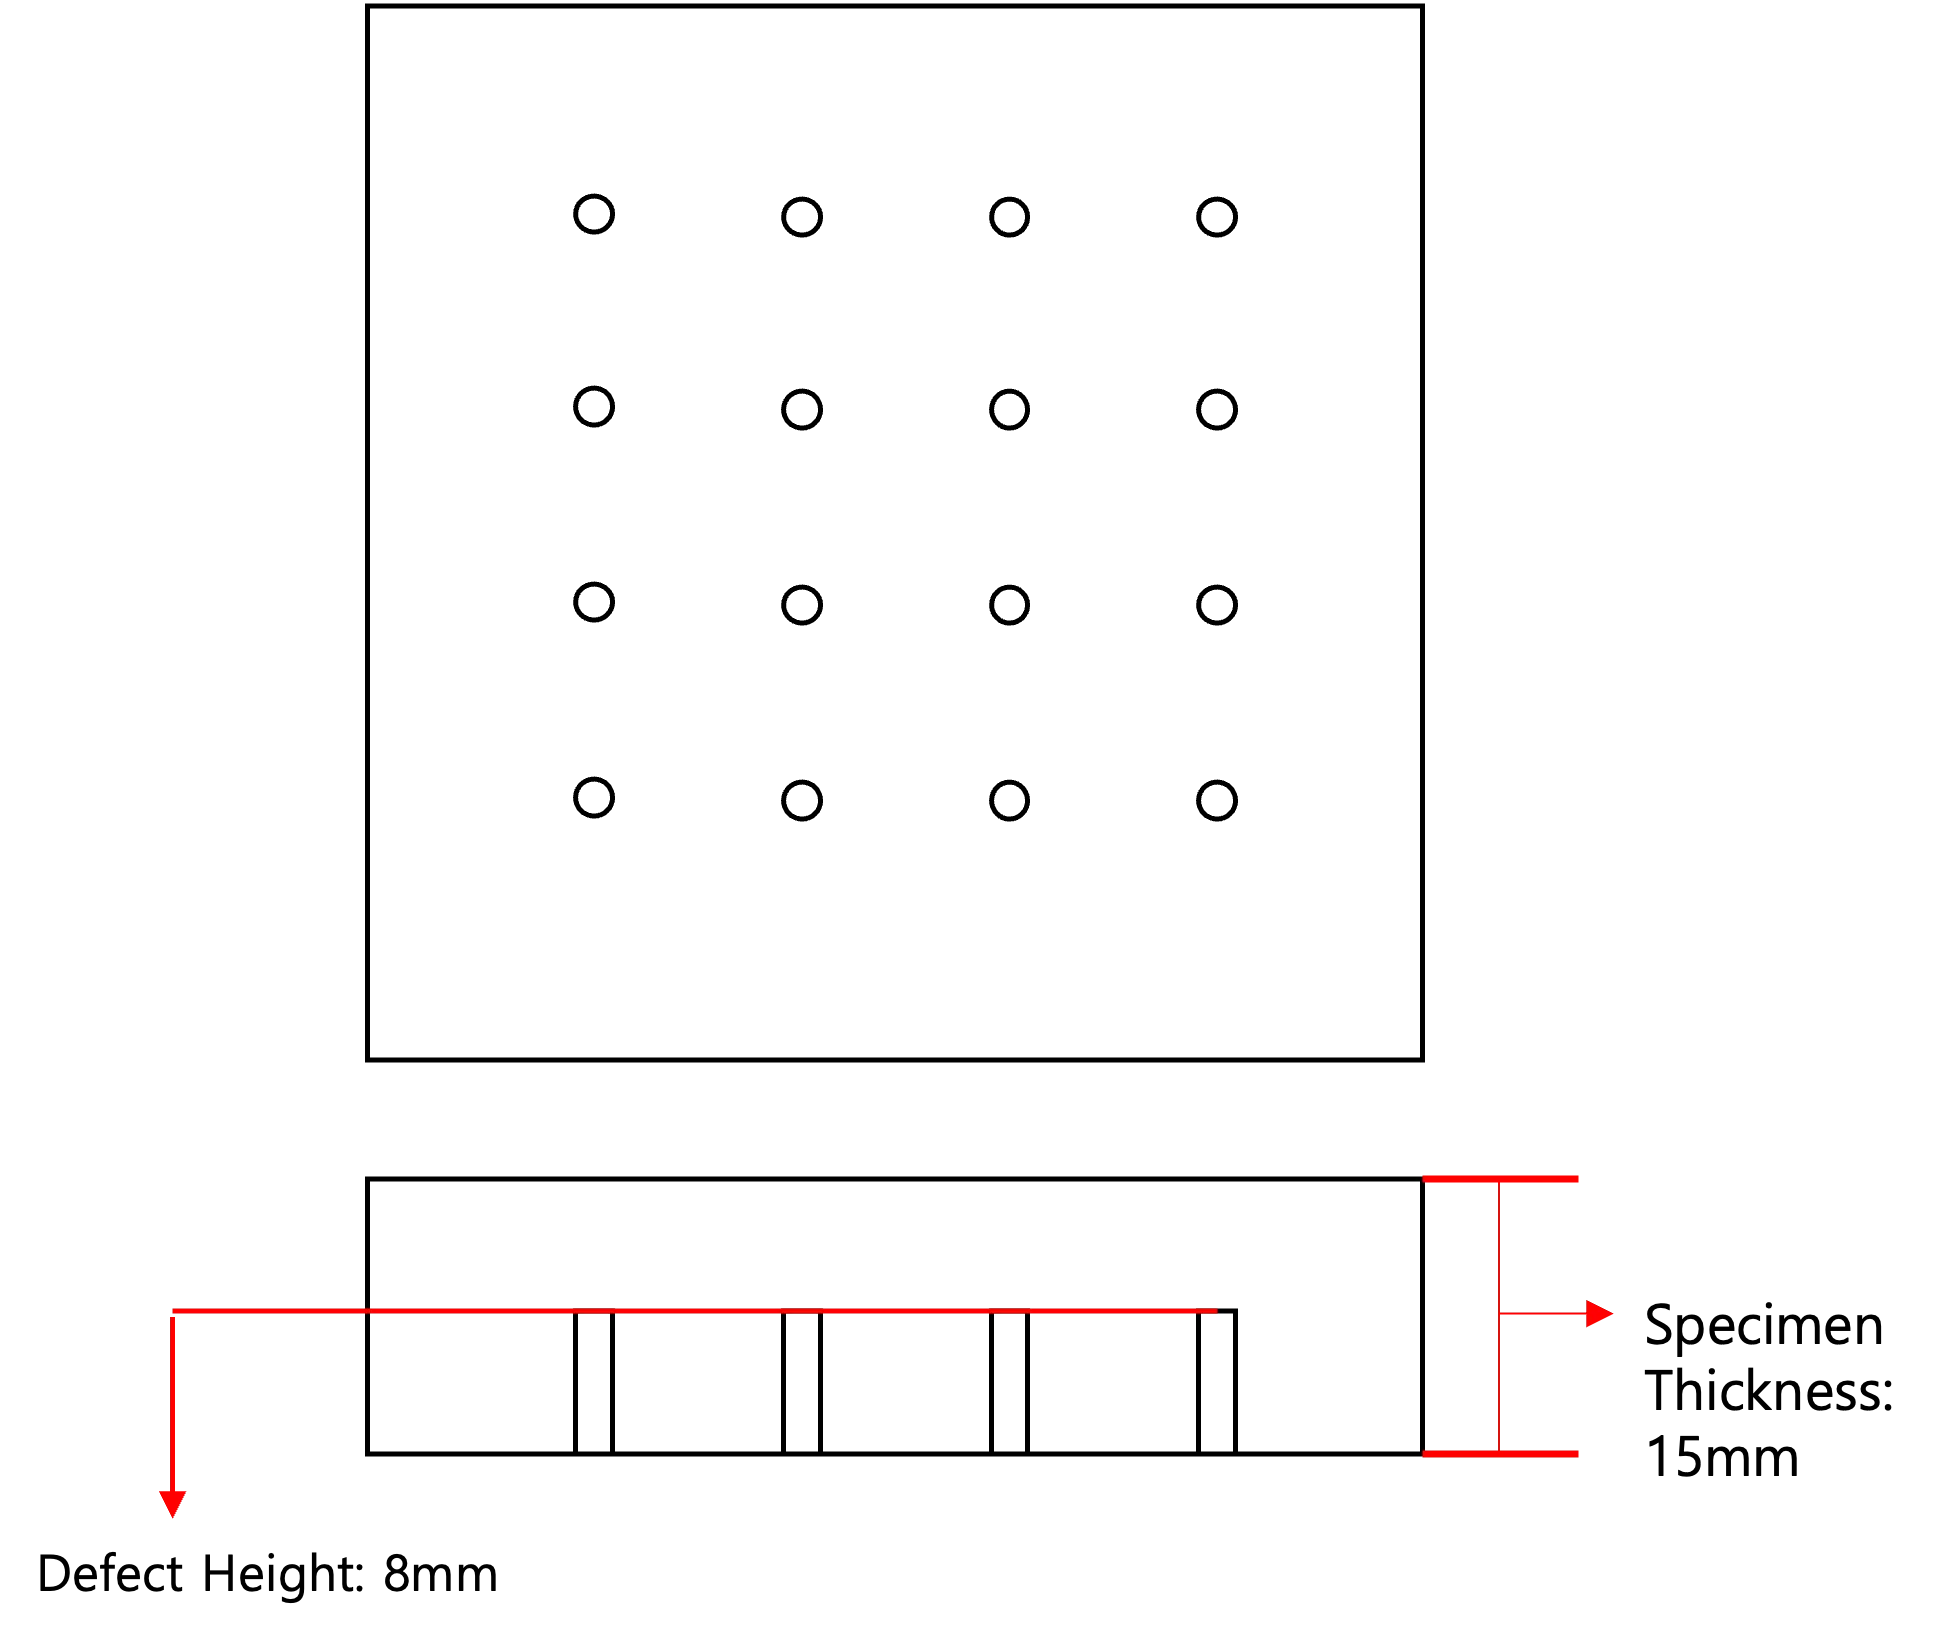
Section titled “Comparing Data #3”- Detailed analysis of thickness variation across the corrosion map.
- DSViewer Interface
- Third-Party Interface
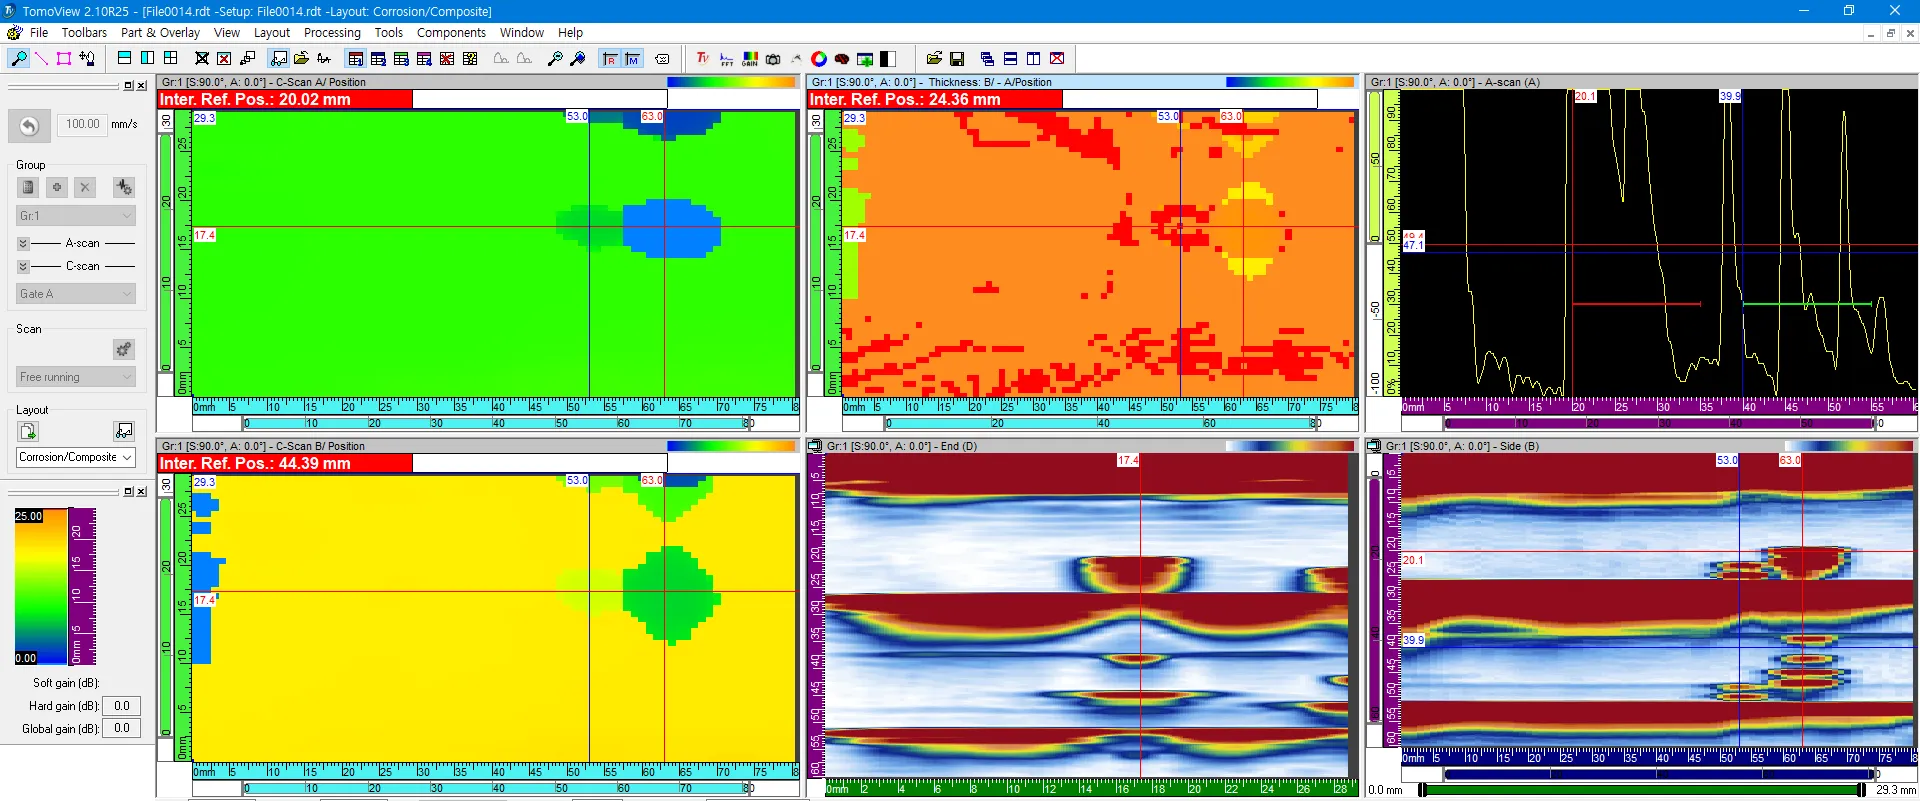
Comparing Data #4
Section titled “Comparing Data #4”- Investigation of specific localized corrosion points.
- DSViewer Interface
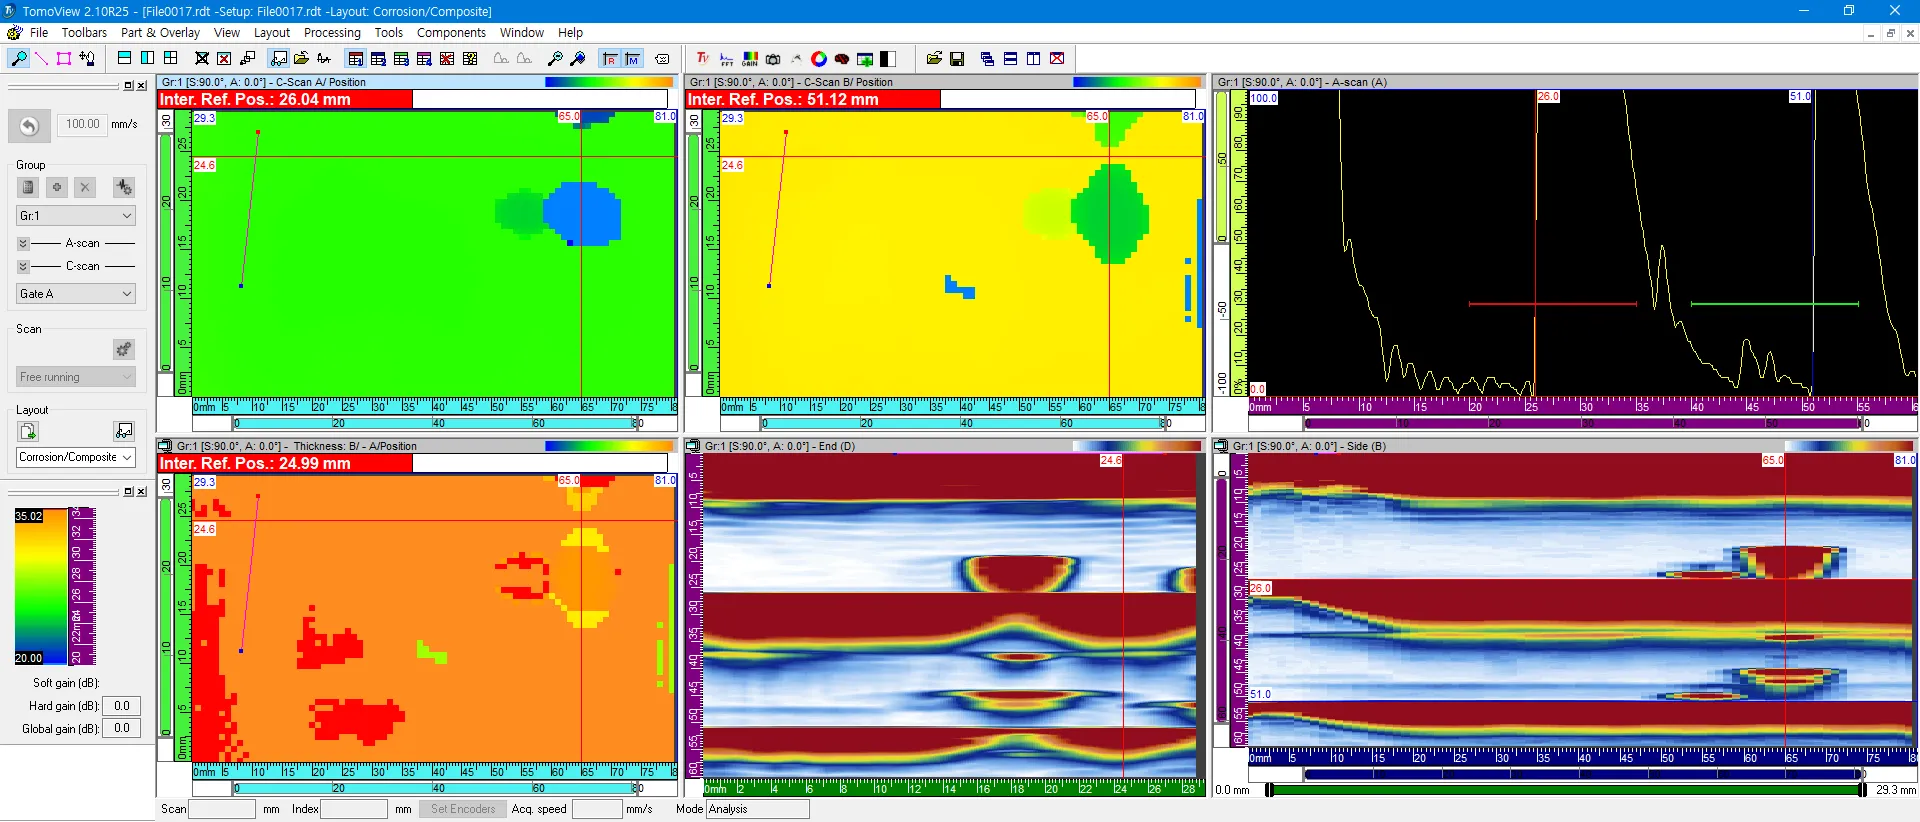
- Third-Party Interface
Conclusion
Section titled “Conclusion”- 1. Color Modulation: Both DSViewer and the third-party program effectively accurately adapt their color displays in correspondence to thickness variations.
- 2. Gate Consistency: The A and B Gates yielded similar results across both systems (as seen in Data #1 through #3).
- 3. Flaw Detection Discrepancy: For the B-A values in Data #4, a discrepancy in flaw detection was noted between the two programs, highlighting differences in sensitivity or processing.