Skip to content
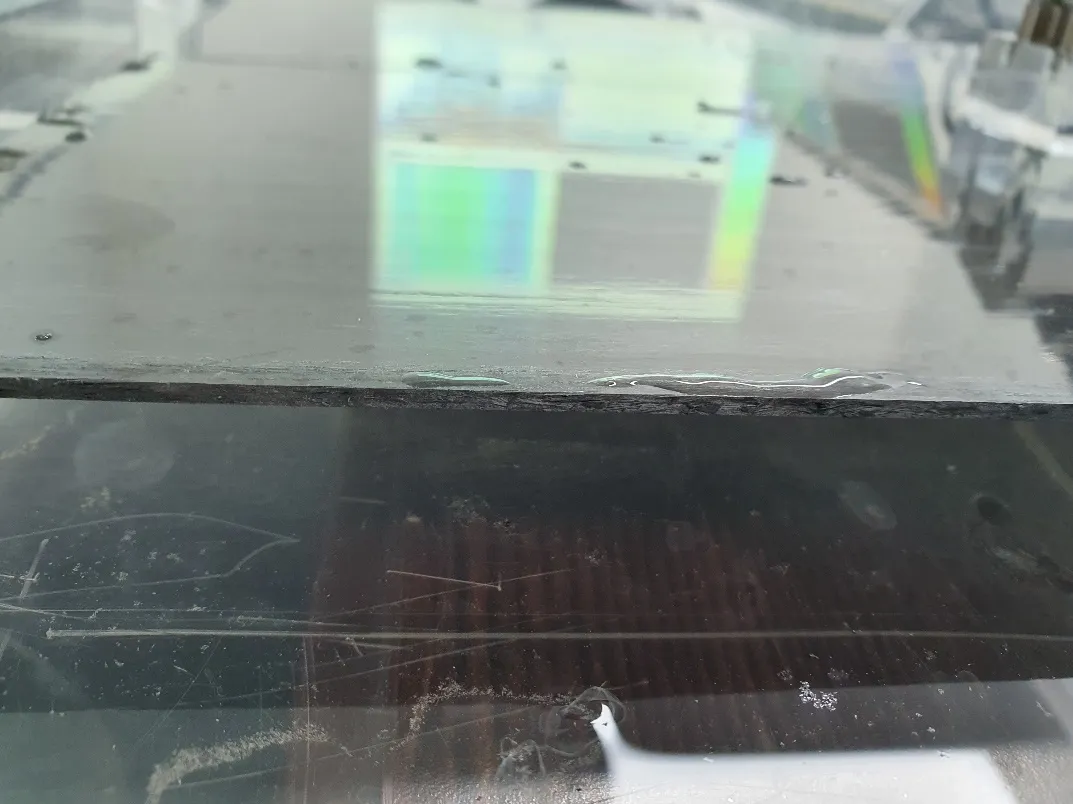
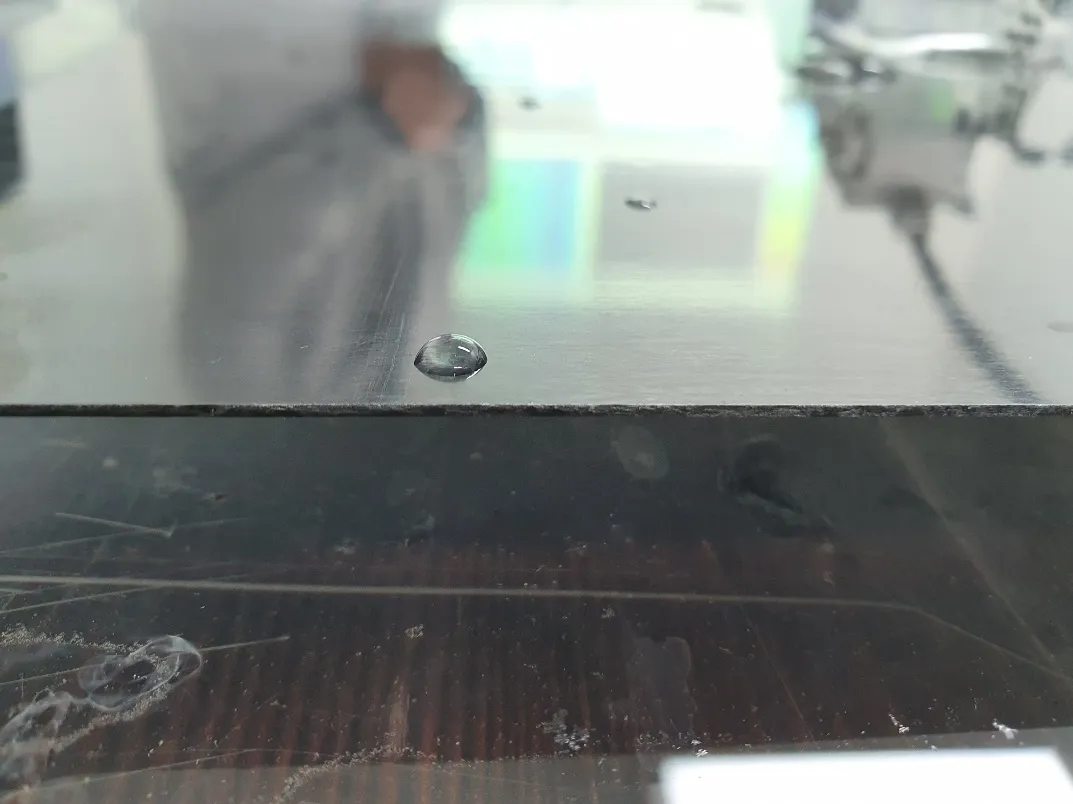
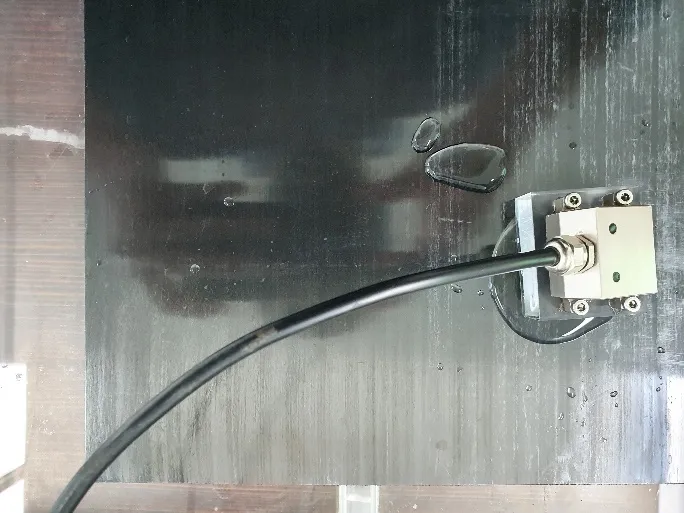
- Using two distinct samples, this test was conducted to accurately identify and measure deviations in thickness caused by corrosion.
- Thickness Range: 1.0 ~ 1.2 mm
- Thickness Range: 2.0 ~ 2.3 mm
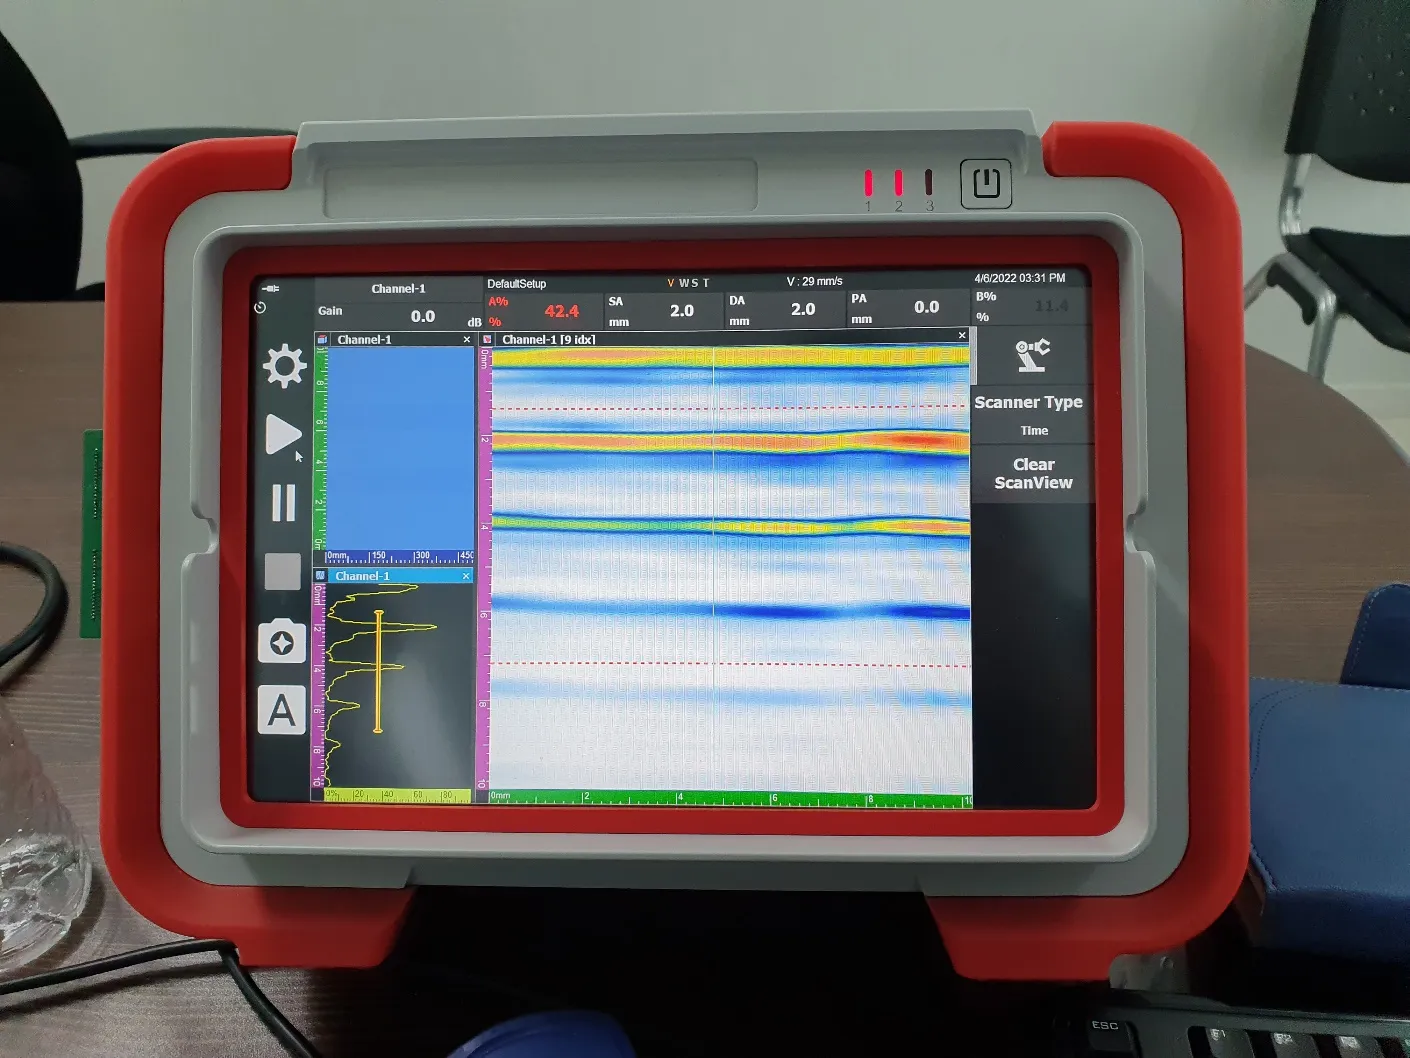
- The inspection was conducted using the DEEPSOUND P5 along with a designated Probe and Wedge.
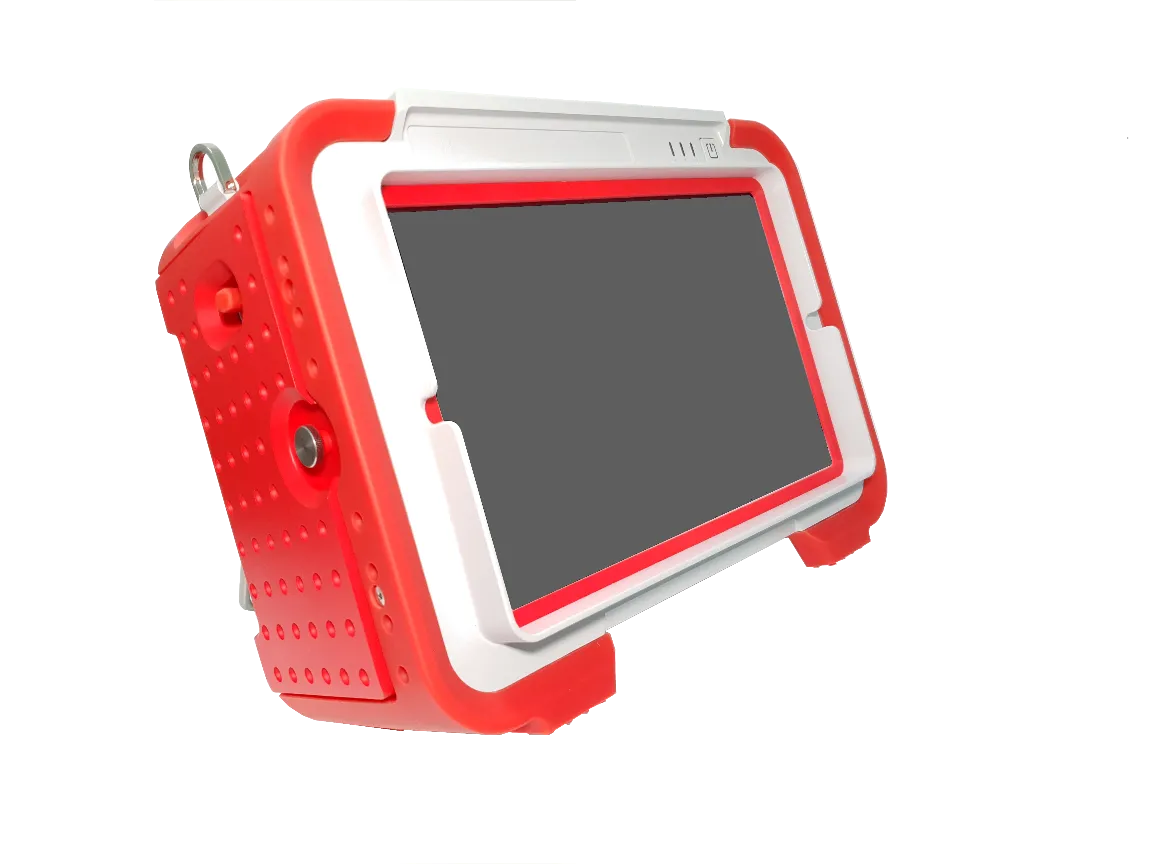
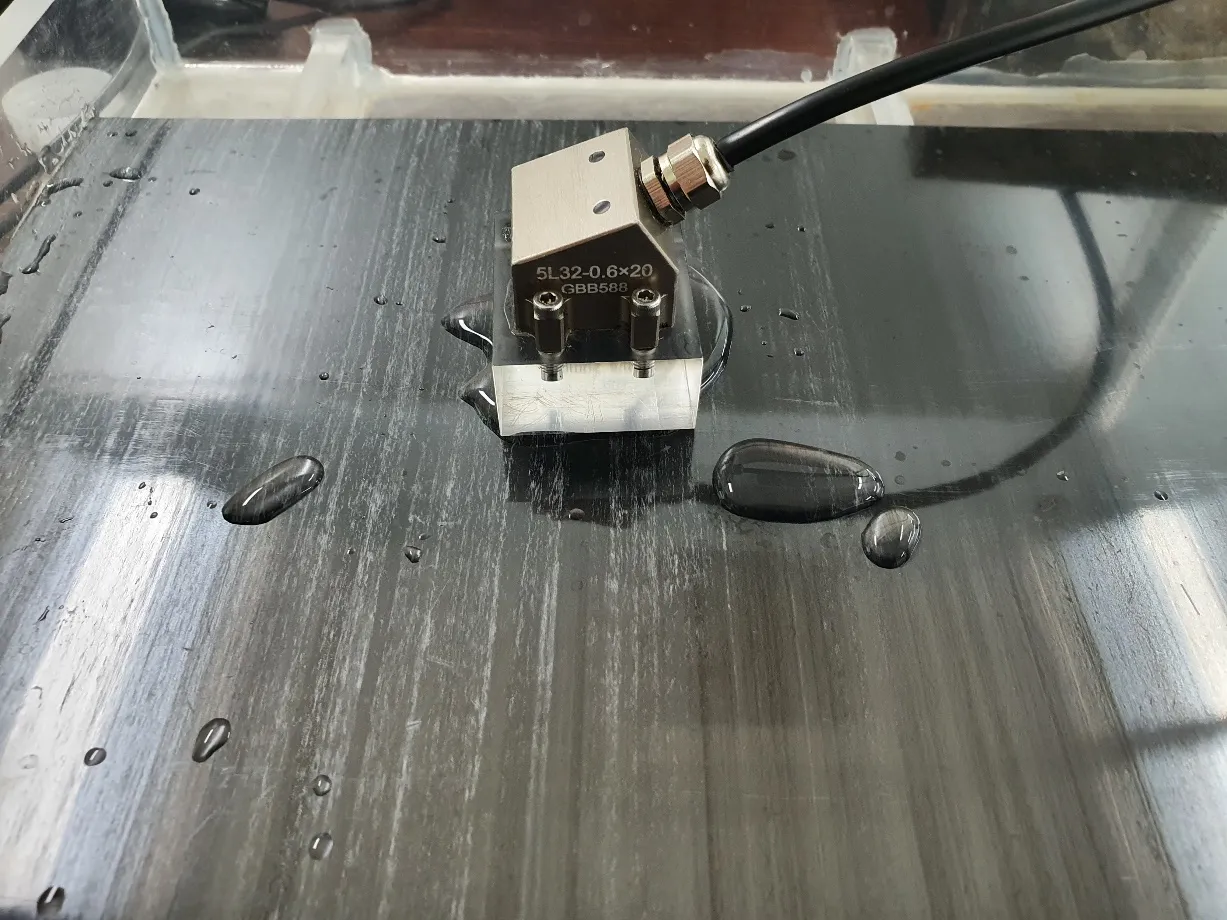
- Probe: 5 MHz
- Wedge: 0 degrees
- Initial scan images of the samples were acquired using the PAVision software. The collected data was subsequently loaded into DSViewer to perform a more precise and detailed corrosion analysis.
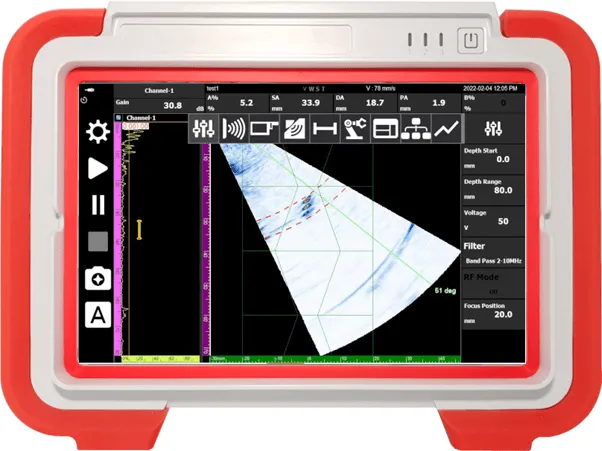
- Portable Dedicated Software: PAVision
- Data Analysis Software: DSViewer
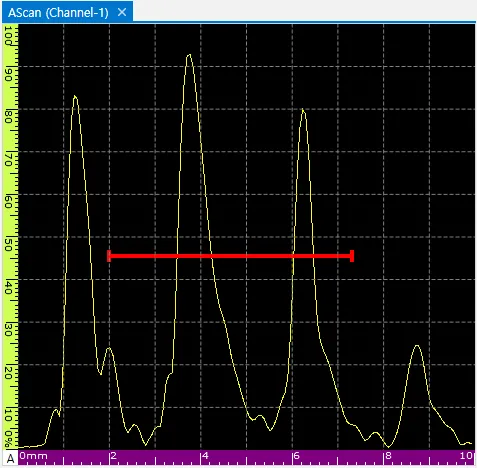
- The following outlines the procedure for measuring corrosion. As demonstrated in the figures below, any deviation in material thickness manifests as a noticeable shift in the detected position, thereby allowing for the accurate observation and measurement of these changes.
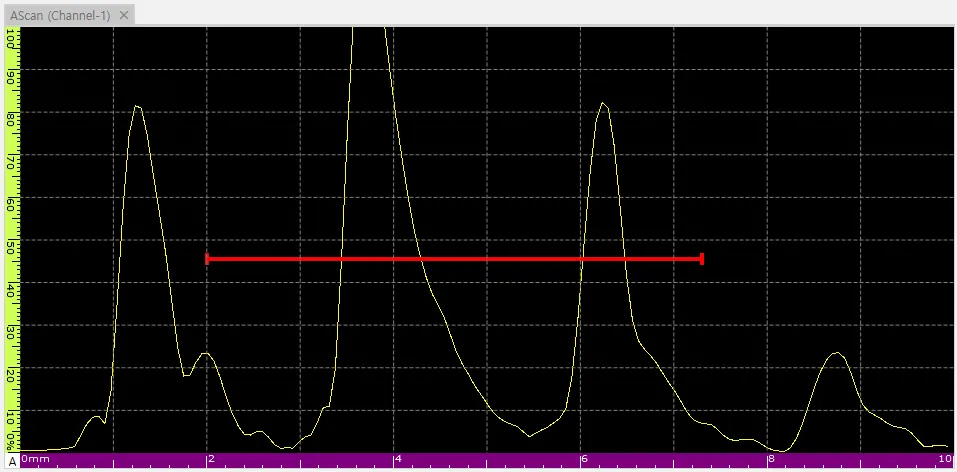
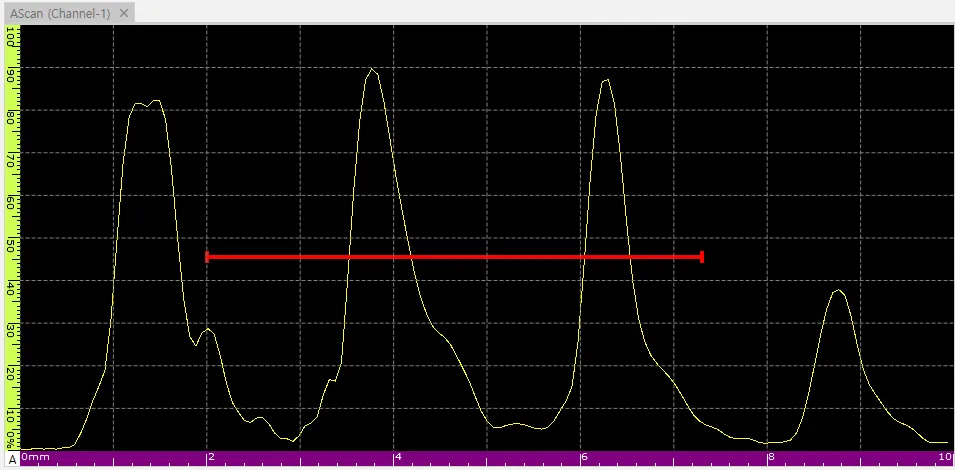
- Thickness measurements are derived by observing the shift in the reference point where the ultrasonic signal intersects the measurement gate.
- Consequently, if the material’s thickness fluctuates during an inspection, the resulting visual representation changes accordingly, as depicted in the images above.
- The following PAUT scan data represents the thickness measurements obtained for Sample #1.
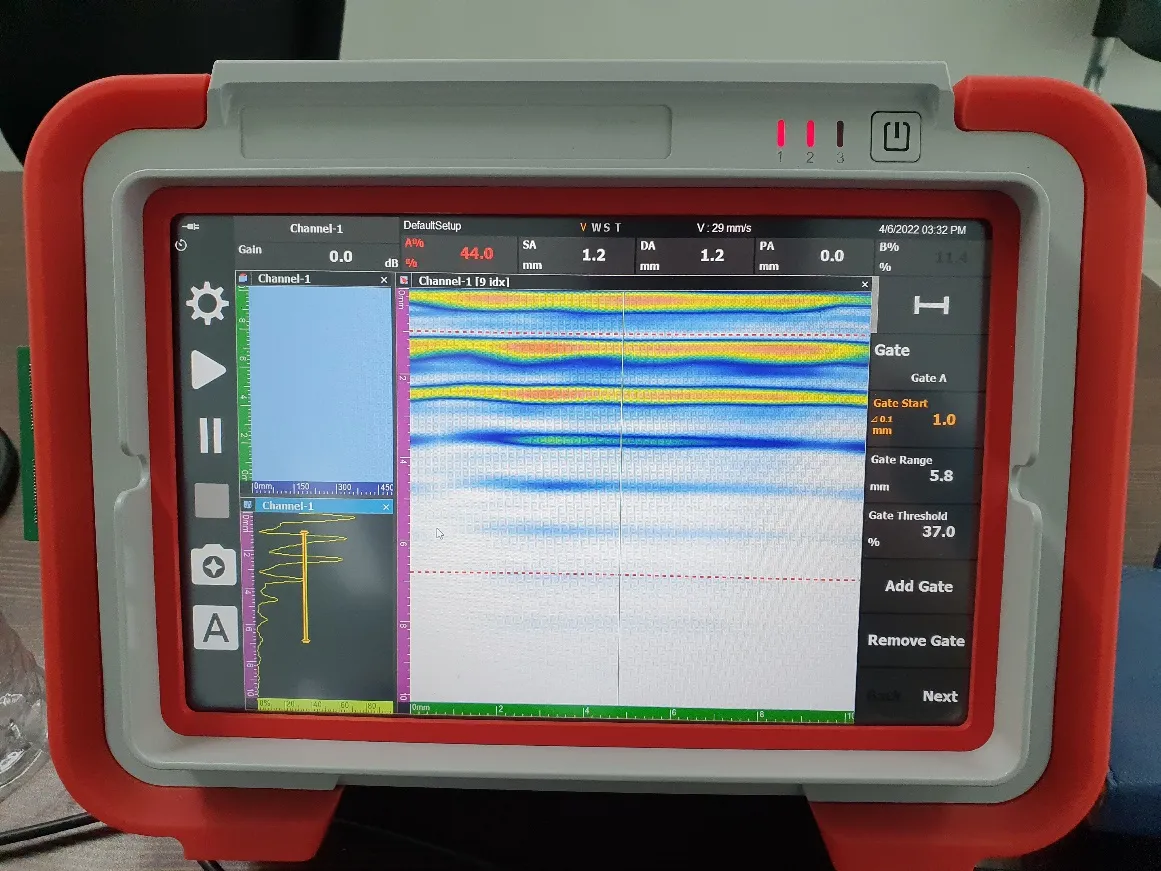
- Software Interface Analysis
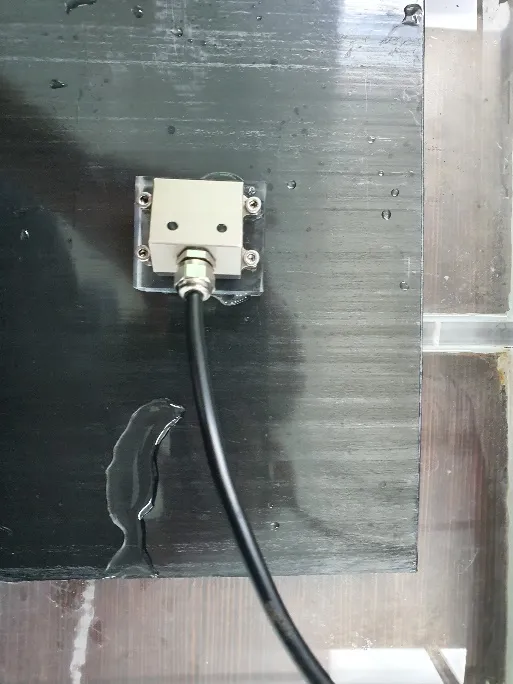
- The following PAUT scan data was acquired during the inspection of Sample #2.
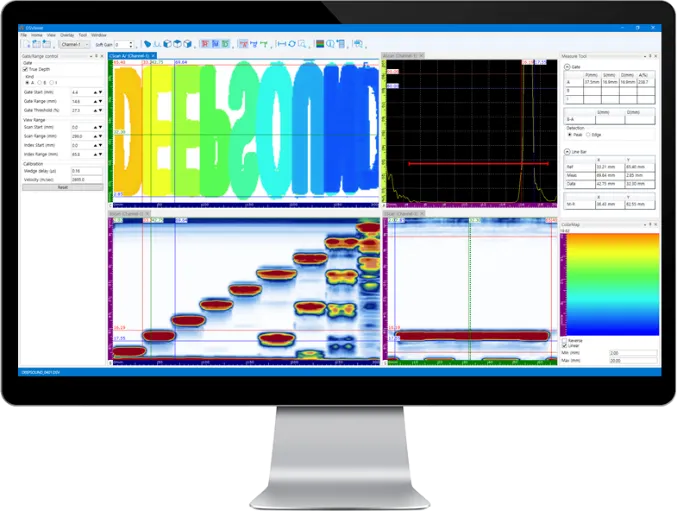
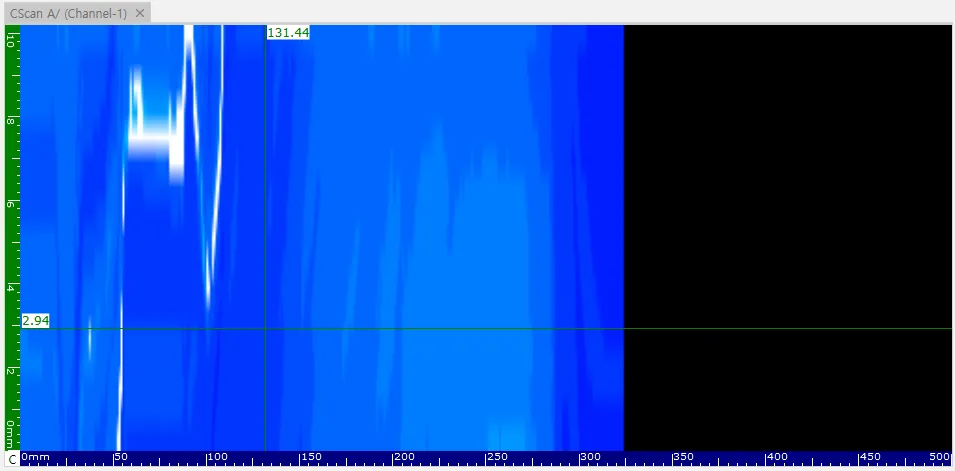
- Thickness Mapping Interface
- Detailed Color-Mapped Results
- Evaluating Average Thickness via Color-Mapped C-Scan:
- 1. The baseline position indicates an average thickness of 3.5 mm.
- 2. Users can identify localized variations by observing significant color deviations relative to the 3.5 mm baseline.
- Tip: Utilize the accompanying ColorMap as a reliable reference to interpret thickness values.
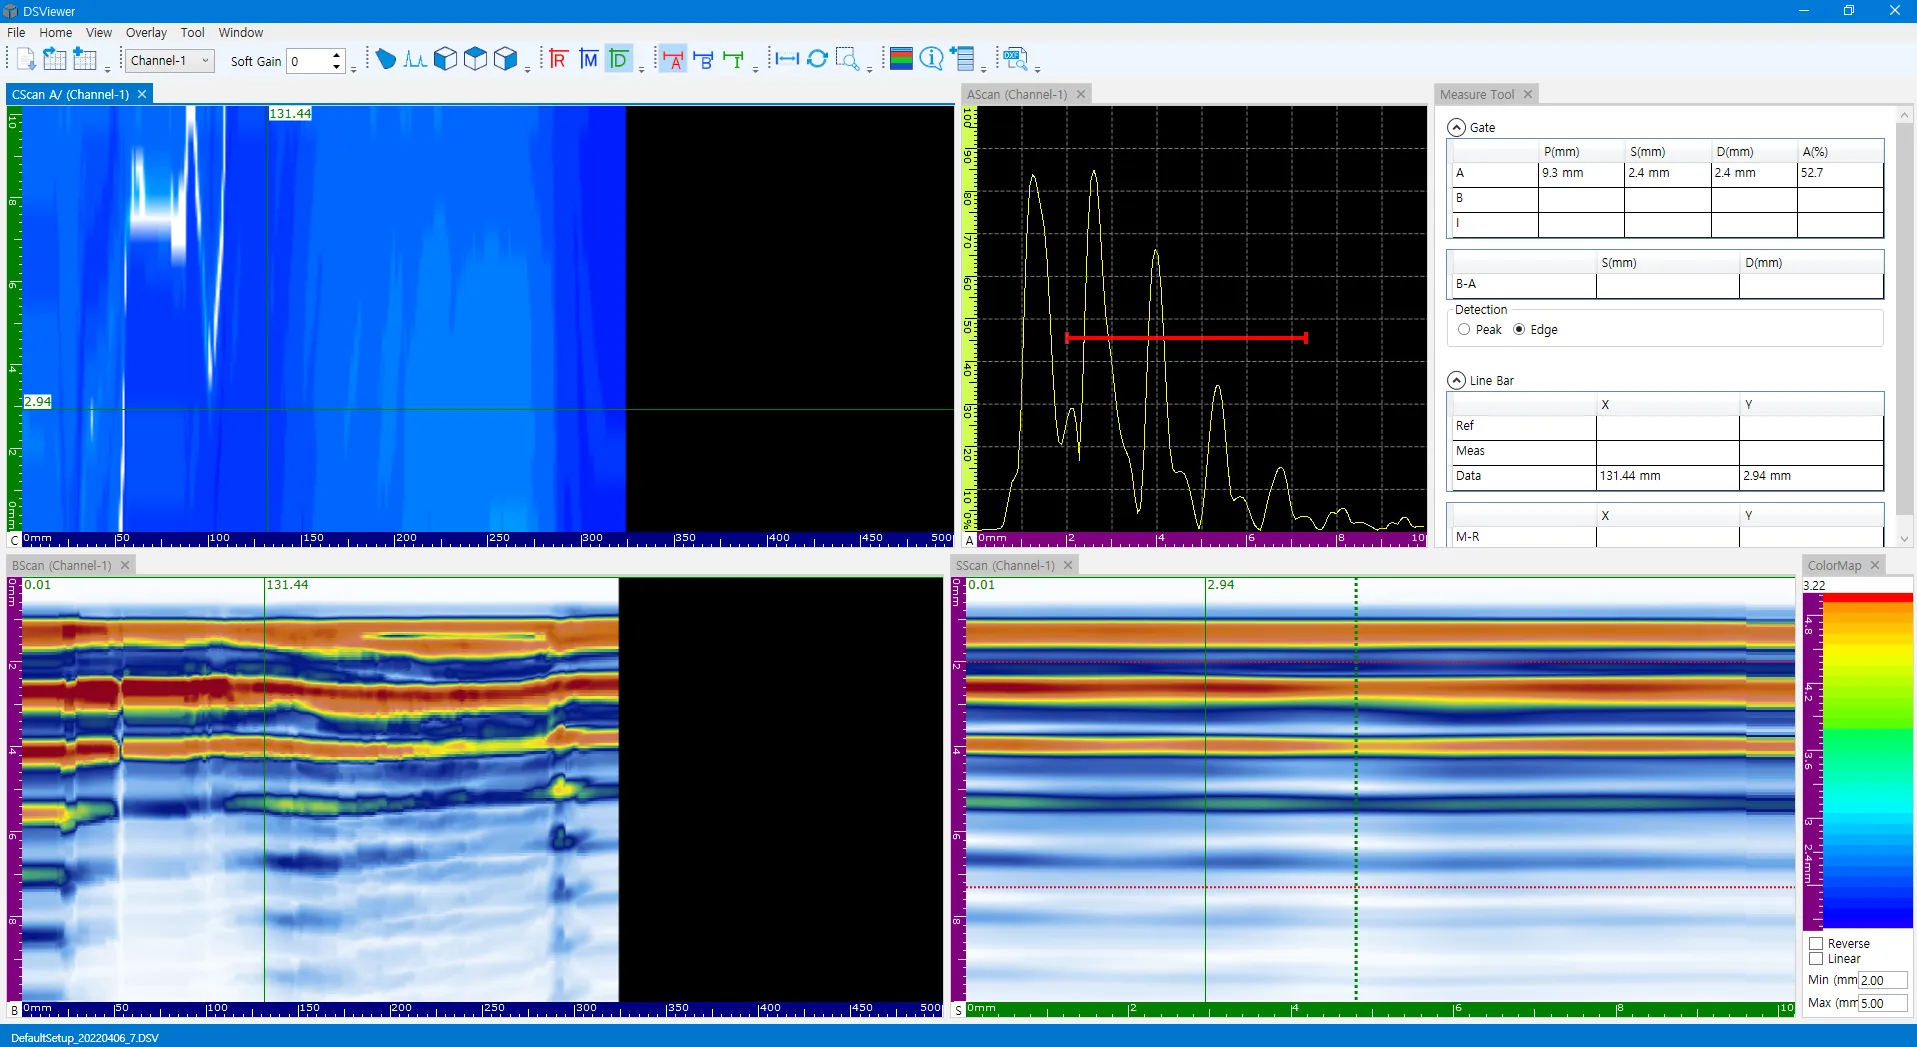
- Sample #1 Full Software Interface View
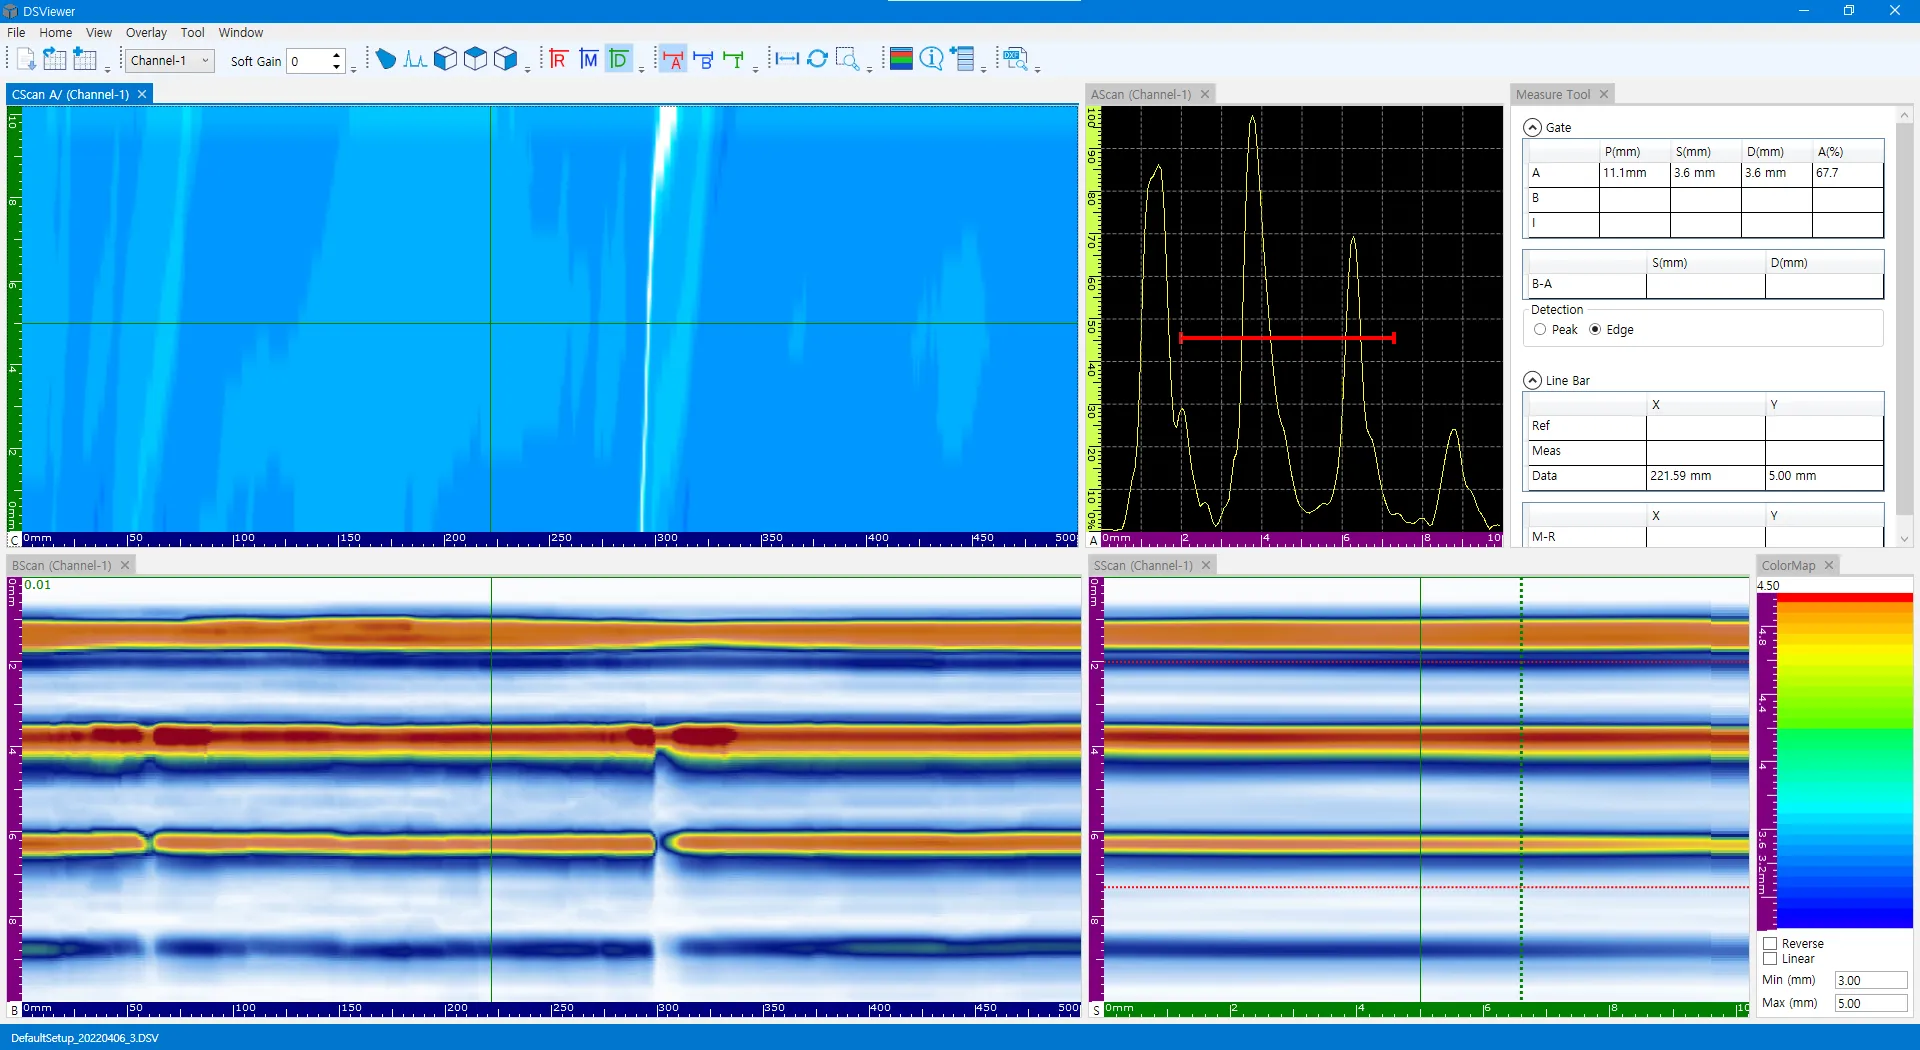
- Sample #2 Full Software Interface View